Hi, what do you want to do?
College Board
AP® Psychology: Teaching Statistics and Research Methodology
Psychologists use statistics? Scholars investigate the research behind the methodology of statistical analysis. Using hands-on practice, case-studies, and scatterplots, they complete various tasks to understand the very roots of high...
Oswego City School District
Regents Exam Prep Center: Displaying Data
Use this lesson, practice exercise, and teacher resource in planning instruction on displaying data. In the lessons, you'll find definitions and examples of ways to collect and organize data, quartiles, and box-and-whisker plots, as well...
CK-12 Foundation
Ck 12: Elem Math: Length Comparisons Using Data Tables
[Free Registration/Login may be required to access all resource tools.] The video shows how to use a data table to answer questions comparing length.
Texas Instruments
Texas Instruments: Mc Dougal Littell Middle School Math: Making Data Displays
Students will create data displays using a scatter plot and a line graph of the data and a circle graph of survey data.
Mangahigh
Mangahigh: Data: Use Frequency Tables
This site provides students practice with the concept of frequency tables. Students can learn about the topic by completing an interactive tutorial. Students can then take a ten question timed test to practice the skill.
Government of Alberta
Learn Alberta: Math Interactives: Exploring Election Data
Using actual Alberta provincial election results, students have the opportunity to interpret election data using a variety of graph types. Pictographs, line graphs, bar graphs, circle graphs, and data tables are covered in this...
Other
Nearpod: Displaying Data: Box Plots
In this lesson, students will learn how to create and intrepret box plots using the 5-number summary.
PBS
Pbs Learning Media: Using Data Clusters to Find Hacker
The CyberSquad searches for Hacker's castle based on a survey of where town residents have last seen him in this video from Cyberchase.
CK-12 Foundation
Ck 12: Statistics: Displaying by Type of Data Grade 8
[Free Registration/Login may be required to access all resource tools.] Create and use different data displays to analyze and draw conclusions about different sets of data.
Khan Academy
Khan Academy: Analyzing Energy for a Simple Harmonic Oscillator From Data Tables
Use your knowledge of simple harmonic oscillator to analyze energy from experimental data with these practice problems.
Center for Innovation in Engineering and Science Education, Stevens Institute of Technology
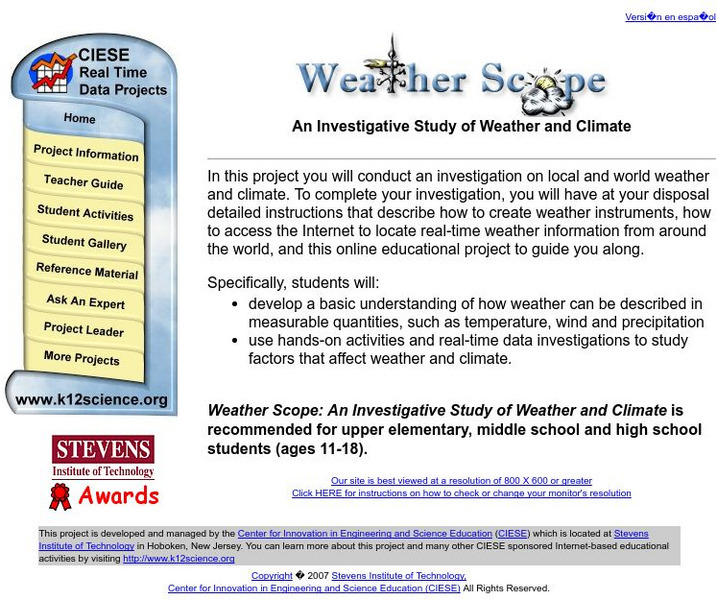
Ciese Real Time Data Projects: Weather Scope: A Study of Weather and Climate
Use real-time data to study factors that affect weather and climate, create weather instruments, and share data with students around the world.
McGraw Hill
Glencoe: Self Check Quizzes 1 Using Bar and Line Graphs
Use Glencoe's randomly generated self-checking quiz to test your knowledge of using bar and line graphs. Each question has a "Hint" link to help. Choose the correct answer for each problem. At the bottom of the page click the "Check It"...
McGraw Hill
Glencoe: Self Check Quizzes 1 Using Graphs to Make Predictions
Use Glencoe's randomly generated self-checking quiz to test your ability to use graphs to make predictions. Each question has a "Hint" link to help. Choose the correct answer for each problem. At the bottom of the page click the "Check...
BBC
Bbc: Ks1 Bitesize: How to Use Simple Data Tables
Explains how to read information from a simple golf scoring table. Students then label the rows and columns in a 2x3 table. [0:26]
Texas Education Agency
Texas Gateway: Selecting and Using Representations for Collected Data
[Accessible by TX Educators. Free Registration/Login Required] Given a variety of data (including line plots, line graphs, stem and leaf plots, circle graphs, bar graphs, box and whisker plots, histograms, and Venn diagrams), the student...
Texas Education Agency
Texas Gateway: Appendices: The Use of Mathematics in Principles of Economics
This appendix should be consulted after first reading "Welcome to Economics." Though economics is not math, there is no important concept in this course that cannot be explained without mathematics. That said, math is a tool that can be...
Texas Education Agency
Texas Gateway: Data Organization
Given field and laboratory scenarios and laboratory data, students will construct data tables and graphs, using repeated trials and means to organize data.
Texas Education Agency
Texas Gateway: Scientific Investigation and Reasoning Data Organization
Using interactive exercises, students will review how to construct tables and graphs in order to organize data.
Texas Education Agency
Texas Gateway: Data, Sampling, and Variation in Data and Sampling
This learning module discusses quantitative and qualitative data, the use of two-way tables in marginal and conditional distributions, how to display data, variation in data and samples, and how to critically evaluate statistical...
CK-12 Foundation
Ck 12: Statistics: Circle Graphs to Display Data Grade 7
[Free Registration/Login may be required to access all resource tools.] Make circle graphs by using given data.
National Council of Teachers of Mathematics
Nctm: Illuminations: State Data Map
Data can be displayed in a variety of ways. This interactive map of the United States shows data by degrees of color. Choose to display data such as: land area, population, population density, gas use, and much more.
McGraw Hill
Glencoe: Self Check Quizzes 2 Using Bar Graphs and Histograms
Use Glencoe's Math Course 2 randomly generated self-checking quiz to test your knowledge of Bar Graphs and Histograms. Each question has a "Hint" link to help. Choose the correct answer for each problem. At the bottom of the page click...
E-learning for Kids
E Learning for Kids: Math: Rice Field: Data and Length
On this interactive website students practice various math skills using a real life scenario of a rice field. Those skills include understanding information displayed in column graphs, collecting data to answer a question, and measuring...
Texas Instruments
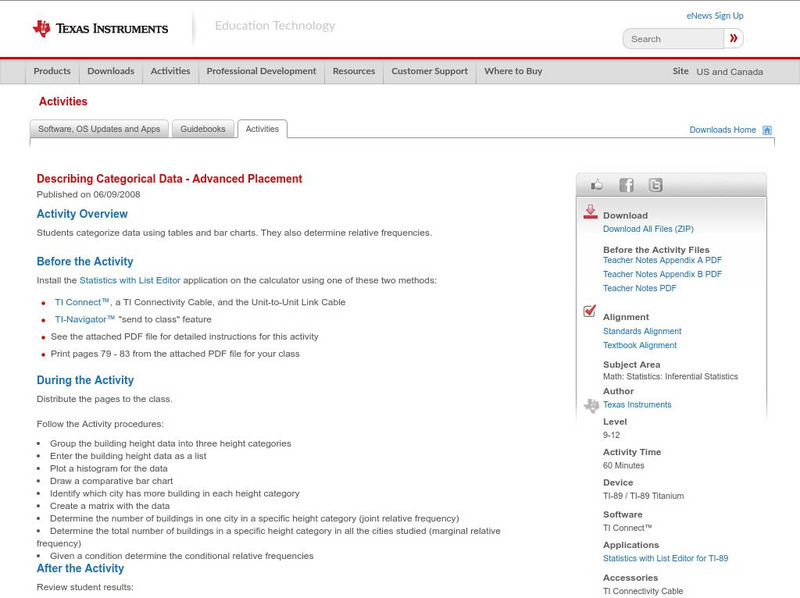
Texas Instruments: Describing Categorical Data Advanced Placement
Students categorize data using tables and bar charts. They also determine relative frequencies.


