US Geological Survey
U.s. Geological Survey: 27 Ideas for Teaching With Topographic Maps
A collection of twenty-seven activities that can be done with topographic maps, for elementary up to university level students. Includes many accompanying resources.
University of California
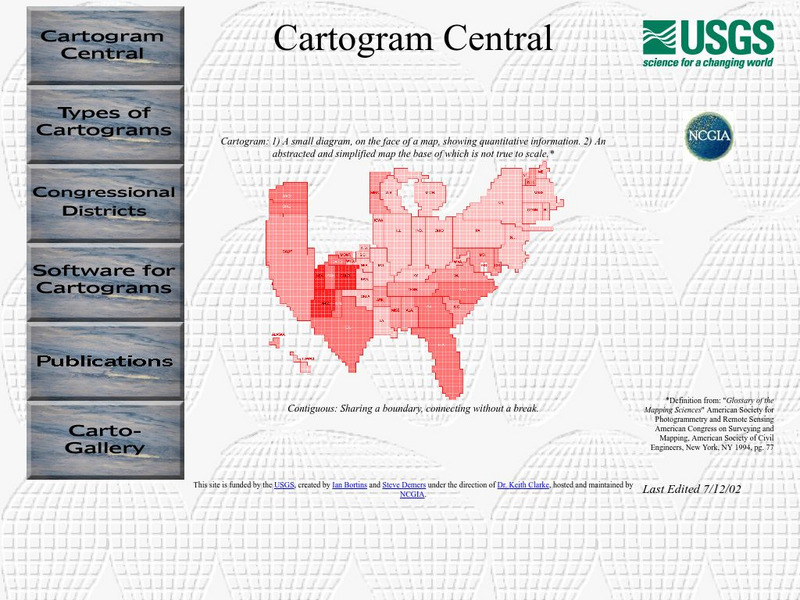
Us Geological Survey: Cartogram Central
The USGS offers detailed information on Types of Cartograms, Congressional Districts, Software for Cartograms, Publications, and a Carto-Gallery.
ReadWriteThink
Read Write Think: Discovering Memory Li Young Lee's Poem "Memonic" and the Brain
Contains plans for eight cross-curricular lessons that teach about memory and the brain using Li-Young Lee's poem "Mnemonic." In addition to objectives and standards, this instructional plan contains links to PDF handouts and sites used...
ReadWriteThink
Read Write Think: A Picture's Worth a Thousand Words: Image to Narrative
This lesson, which can be adapted to fit with any picture you choose, works for students of all levels.
US Geological Survey
United States Geoglogical Survey: Resources for Teachers
USGS provides lesson plans, activities, maps, podcasts, online lectures, videos and animations, and lots more. Covers all grade levels.
Daily Teaching Tools
Daily Teaching Tools: Additional Webs
This Daily Teaching Tools resource provides a series of graphic organizers. Students will be able to plan the writing of summaries, paragraphs, and literary responses.
Central Intelligence Agency
Cia: World Factbook: Regional and World Maps
Website from the Central Intelligence Agency (CIA) provides interactive reference material for regional and world maps in the World Factbook Library. Students and teachers can search for information about any country in the world.
Google
Google for Education: Applying Discrete and Continuous Data in a Map
Using various tools, student will be able to analyze and calculate the amount of urban open space available in their city.
Other
National Arbor Day: Educational Resources
This collection of resources provides Arbor Day classroom activities for students in areas ranging from science to the arts. Students can learn plant identification, write poems or plays and quiz each other on tree facts.
Other
Gapminder: Unveiling the Beauty of Statistics for a Fact Based World View
Gapminder collects hundreds of statistics related to global economic, health, and social development and analyzes the relationships between them across different countries and time (a few indicators go back to 1800).
National Geographic
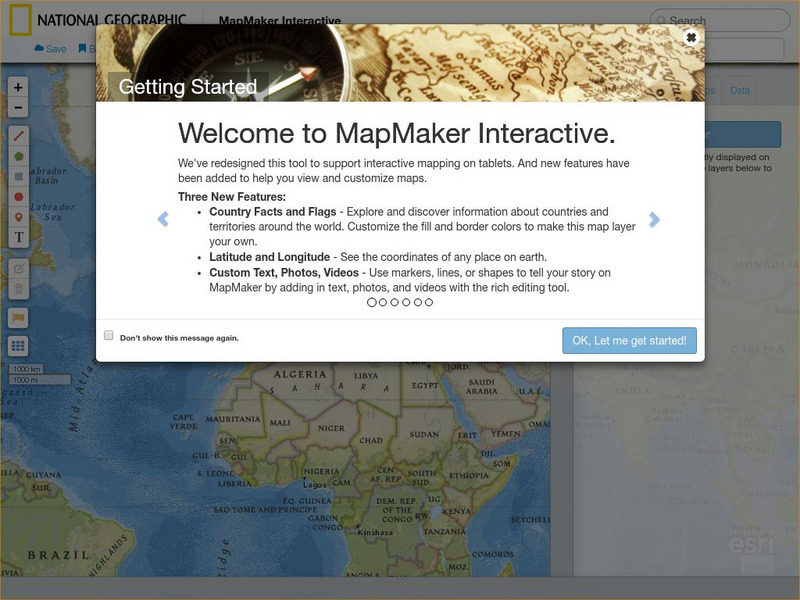
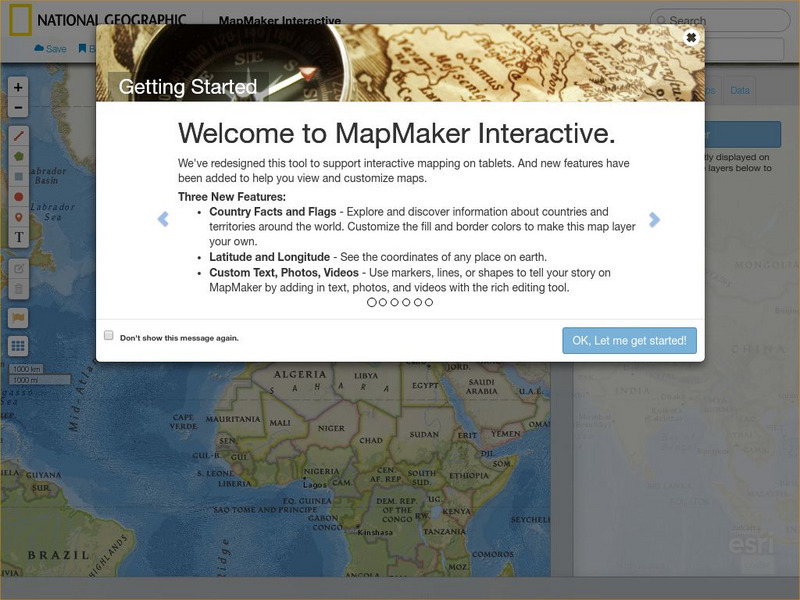
National Geographic: Mapmaker Interactive
Interactive map maker in which students can manipulate world maps adding layers and data with multiple sources of information.
Utah Education Network
Uen: Graphic Organizers Bring About Good Science Read/writing
This lesson uses graphic organizers to engage students in reading comprehension strategies for informational text in science. Venn Diagram, Hierarchy, Time Line, Cluster Diagram, and Flow Chart reproducible pages are included with the...
Other
Physical Geography: Glossary of Terms
Teachers who are looking for a complete course study in physical geography need this site. It is very well organized and colorfully designed. It contains an online glossary, study guides, links, clip art, maps etc.
Stanford University
Sheg: Document Based History: Reading Like a Historian: Historical Thinking
[Free Registration/Login Required] This chart elaborates on the historical reading skills of sourcing, corroboration, contextualization, and close reading. In addition to questions that relate to each skill, the chart includes...
Utah Education Network
Uen: Setting a Purpose for Reading Using Informational Text
This lesson engages students in using a two-column graphic organizer to take notes. Students will record titles and subtitles and list questions that will correspond with each one.
Utah Education Network
Uen: Using a Before Reading Organizer With Informational Text
This module provides strategies to use with informational text. Teachers will explicitly teach students about graphic organizers to use before reading informtational texts.
Annenberg Foundation
Annenberg Learner: Renaissance: Exploration and Trade
Detailed introduction on exploration and trade during the Renaissance. Provides an overview of the tools created during the Middle Ages that made such travels by sea possible as well as insight into the types of goods traders sought in...
National Geographic
National Geographic: Map Maker Interactive and 1 Page Map Maker
This National Geographic feature allows visitors to create their own world maps complete with capitals, oceans, climate information, satellite view, personalized trail markings and more. Choose from a detailed color map or the second...
Sophia Learning
Sophia: Note Taking: Concept Maps and Flow Charts
This slideshow lesson focuses on note taking using concept maps and flow charts; it provides background information, 6 types of concept maps or flow charts with best uses, uses in the classroom, uses while reading or researching, and how...
Council for Economic Education
Econ Ed Link: Econ Ed Link Collection
Use this collection of economic education lessons for K-12 teachers and students to improve financial literacy. One interesting feature is "This Day In Economic History," a calendar which identifies an interesting event for each day,...
University of Maryland
University of Maryland: Langscape
This educational tool will identify the languages spoken anywhere on the map. Click on a country to discover which language or languages are native. Scroll to the bottom and find additional resources about the language/country selected.
Education Development Center
Tv411: Reading: Parts of a Newspaper: Activity 3 of 3
This newspaper activity is to look at the pictures provided, read what the stories are about, and select captions that would fit both the stories and the pictures.
Texas Education Agency
Texas Gateway: Synthesize Ideas in Informational/expository Text
[Accessible by TX Educators. Free Registration/Login Required] Learn how to synthesize and make logical connections between ideas within a text and across two or three texts representing similar or different genres and to support the...
Texas Education Agency
Texas Gateway: Evaluate Graphics in Informational/procedural Text
You will learn how to evaluate graphics for their clarity in communicating meaning and achieving a specific purpose.

