Hi, what do you want to do?
Sophia Learning
Sophia: Finding Rates of Change in Linear Relationships
Explore how to find the rate of change in functions with linear relationships and take a quiz to assess learning.
Sophia Learning
Sophia: Graphs of Constant Rates of Change
Compare two lines to determine which one is a constant rate of change.
Sophia Learning
Sophia: Independent and Dependent Variables
Determine the independent and dependent variables of liner equations using real world applications. Take quiz to assess learning.
Sophia Learning
Sophia: Independent and Dependent Variables
Determine which variable is independent and dependent when plotting points on a graph. Check understanding with a quiz.
Sophia Learning
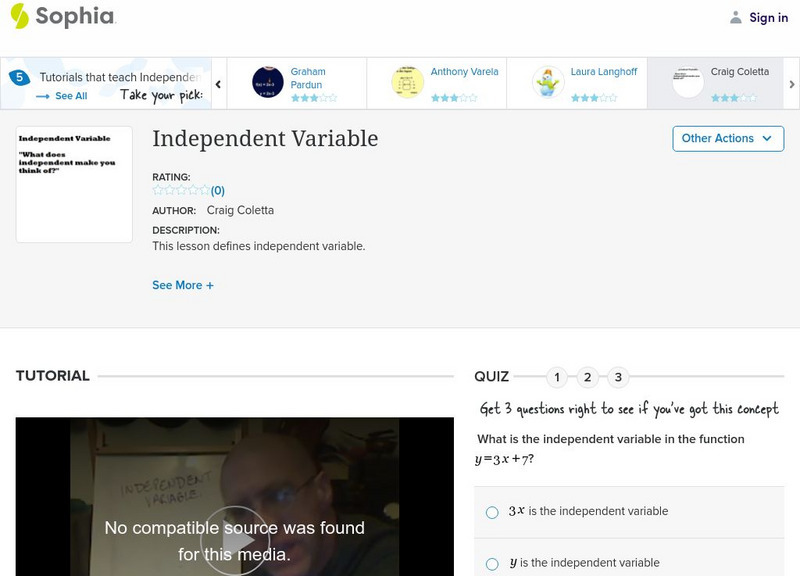
Sophia: Independent Variable
The concept of independent variable is described in this video tutorial. The lesson provides detailed examples.
Sophia Learning
Sophia: Independent Variable
Determine what an independent variable is and how to apply the variable.
Sophia Learning
Sophia: Interpreting Scatter Plots
Explore the relationships between given data using scatter plots and determine whether the correlation is negative, positive, or no correlation. Assess learning with a quiz.
Sophia Learning
Sophia: Linear Equations From Tables of Data
This video tutorial demonstrates how to create a table of ordered pairs to test if a function is a linear equation. [4:43]
Sophia Learning
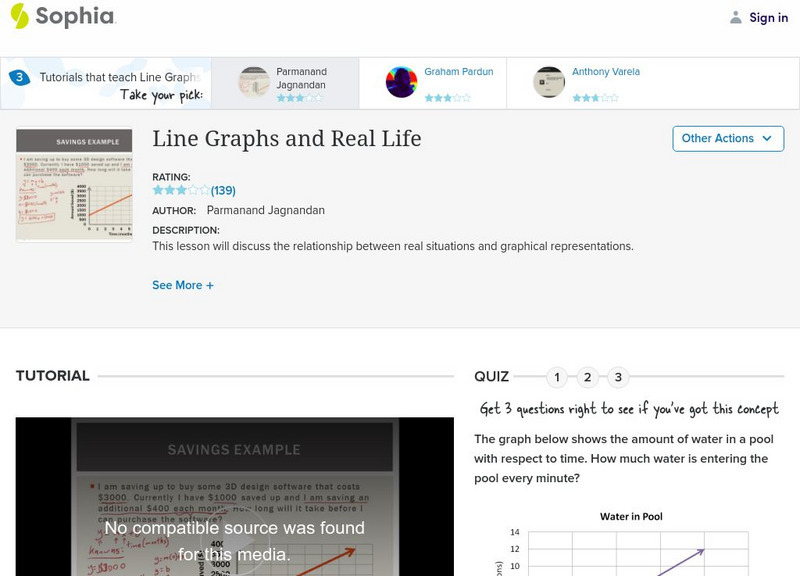
Sophia: Line Graphs and Real Life
This video lesson demonstrates how to create a line graph to solve two real world math problems.
Sophia Learning
Sophia: Slope and Constant Rate of Change
Explore the relationship between slope and the constant rate of change for linear functions. Assess learning with a quiz. [3:42]
Sophia Learning
Sophia: Slope Intercept Form and Direct Variation
Explore the relationship bewteen slope-intercept form, slope, and direct variations and assess learning with a quiz.
Sophia Learning
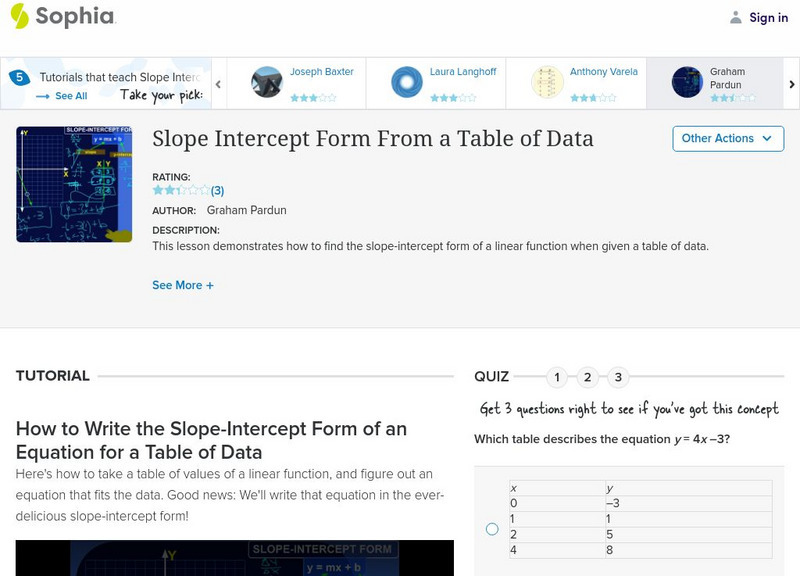
Sophia: Slope Intercept Form From a Table of Data
Use a table of data to find the slope-intercept form of a linear function. Take a quiz to assess learning.
Sophia Learning
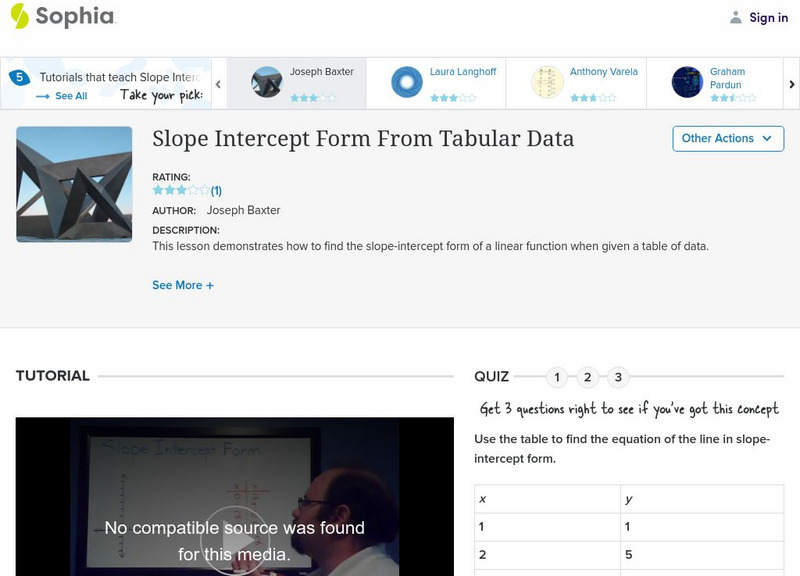
Sophia: Slope Intercept Form From Tabular Data
Use a table of data to determine the slope-intercept form of a linear function. Take a quiz to assess learning.
Sophia Learning
Sophia: Applications of Function Notation
Explore how relationships such as distance and time, velocity and time, etc. can be expressed with function notation. Assess learning with a quiz. [1:52]
Sophia Learning
Sophia: Applications of Function Notation
This video lesson provides a real-world application of function notation. Students can check their understanding with an assessment. [3:11]
Khan Academy
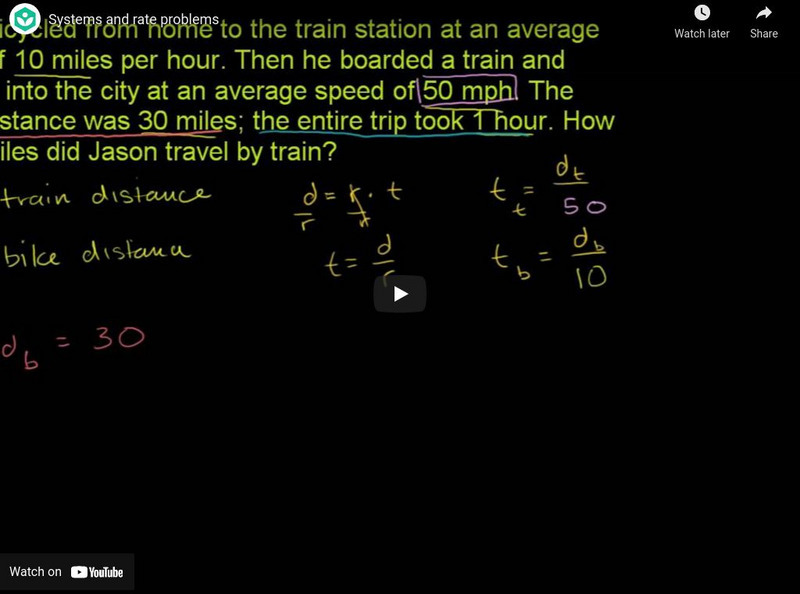
Khan Academy: Systems of Equations Word Problems: Systems and Rate Problems
This video demonstrates how to set up and solve a system of equations in order to solve a word problem concerning rates.
Sophia Learning
Sophia: Graphs of Constant Rates of Change
This video tutorial describes how to determine if a graph has a constant rate of change. It includes detailed examples.
Sophia Learning
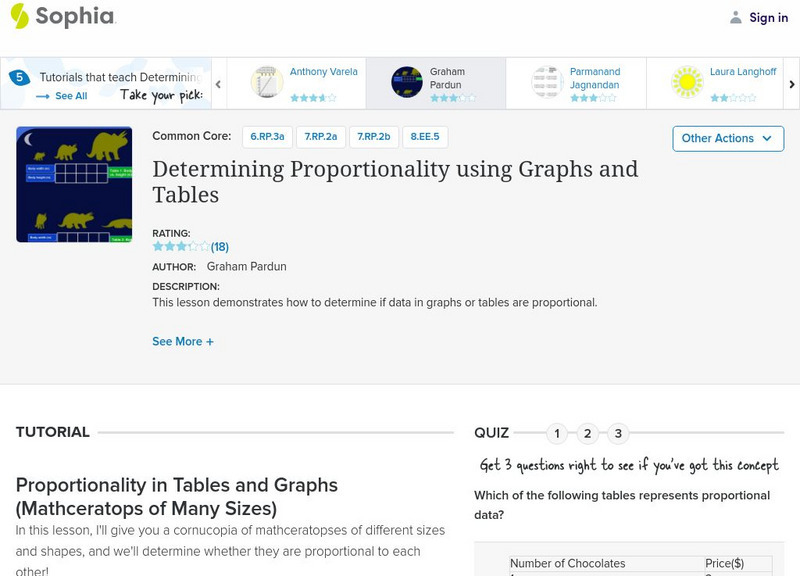
Sophia: Determining Proportionality Using Graphs and Tables
Determine whether objects of different shapes and sizes are proportional. Check understanding with a quiz.
Sophia Learning
Sophia: Graphing Linear Functions
Graph a linear function on a coordinate plane using the x- and y-intercepts. Assess learning with a quiz. [9:18]
Sophia Learning
Sophia: Determining Non Linearity From a Graph
Using a graph, determine if a function is linear or nonlinear. Assess learning with a quiz.
Sophia Learning
Sophia: Linear and Non Linear Relationships
Explore linear and nonlinear relationships and how to recognize the graphical representations of both. Assess learning with a quiz.
Khan Academy
Khan Academy: Slope: Slope Example
This video demonstrates how to calculate the slope when given data in the form of dependent and independent variables. It also shows how to interpret what the slope means in an application problem.
Study Pug
Study Pug: Advantages and Disadvantages of Different Graphs
This lesson discusses the advantages and disadvantages of using different types of graphs to display data, such as pictographs, line graphs, and bar graphs. [3:08]
Loyola University Chicago
Math Flix: Variables Puzzles
This QuickTime movie provides an excellent opportunity to figure out what values different variables should have. As you watch and listen to the teacher and student interact it helps clarify the thinking behind applying this concept.


