Hi, what do you want to do?
Better Lesson
Better Lesson: 100 Students Project: Conducting the Survey
What are the procedures for administering the survey? Why is this important? Students conduct survey with other classes.
Better Lesson
Better Lesson: 100 Students Project: What Do We Want to Know About Our Students?
What makes a question a statistical question? Students learn about statistical and non-statistical questions and then use that knowledge to brainstorm survey questions for their classmates.
Better Lesson
Better Lesson: Statistically Speaking....
Determining a good statistical question is the foundation of statistics.
Better Lesson
Better Lesson: 100 Students Project: Project Reflection
Sixth graders watch their 100 Students video and reflect on their learning during the project.
Cuemath
Cuemath: Average
A comprehensive guide for learning all about averages with definitions, uses, how to calculate it, , solved examples, and practice questions.
ibiblio
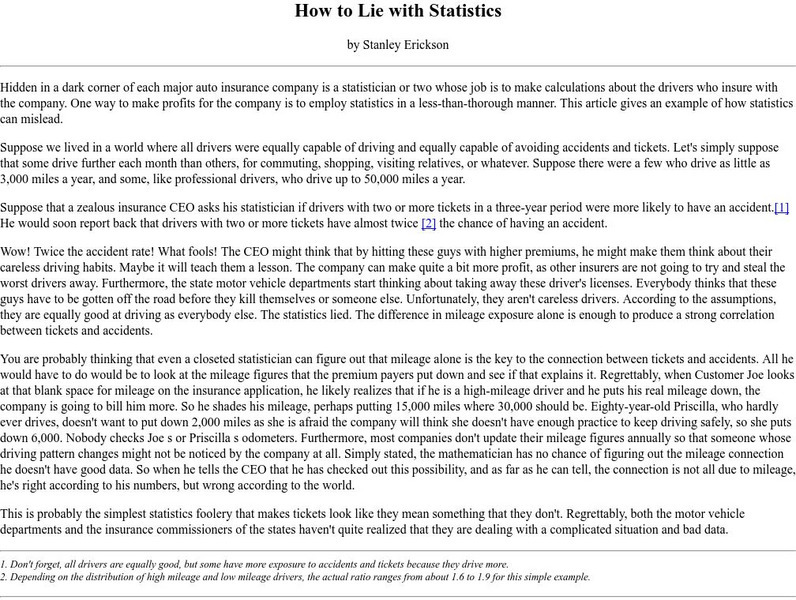
Ibiblio: How to Lie With Statistics
A real-world example of how statistics can be used to lie. In this case, it is the issue of speed limits and insurance premiums.
National Council of Teachers of Mathematics
The Math Forum: Ask Dr. Math: What Is a Regression Line?
This page is an answer to an email question that someone wrote in and it explains what a regression line is.
Rice University
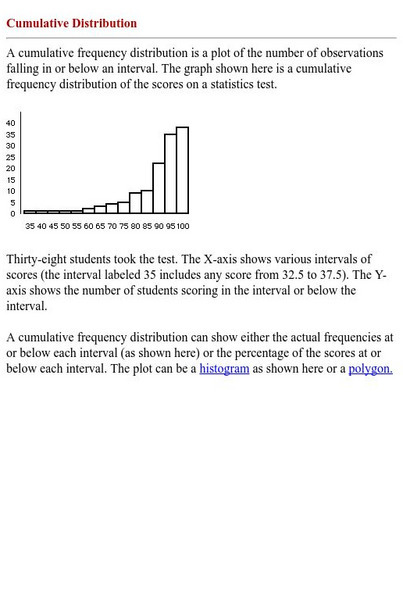
Hyper Stat Online Statistics Textbook: Cumulative Distribution
This resoruce explains how to read a cumulative frequency distribution graph.
US Department of Education
National Center for Education Statistics: Nces Classroom
Just what is the NCES Students' Classroom? In addition to many useful features, this site provides math and statistical activities tailored to a middle and elementary school students.
Soft Schools
Soft Schools: Outliers
On this websites students explore the concept of outliers. Students are given several data sets and investigate how outliers can effect the mean and median of a data set.
Varsity Tutors
Varsity Tutors: Hotmath: Algebra Review: Frequency Distributions
Find a quick, concise explanation of frequency distributions. An example is given and clearly explained.
Teachnology
Teachnology: Teacher Guide to Probability and Statistics
Statistics Theme provides a collection of free sample worksheets, teacher resources, lesson plans and interactive media for grades k-12.
Shmoop University
Shmoop: Basic Statistics & Probability: Box & Whisker Plots
Students learn about box and whisker plots. Notes, examples, and practice exercises are included in the statistics resource.
That Quiz
That Quiz: Probabilidad
Test your knowledge of probability by taking this practice test. Five levels are provided and it also tracks the number of correct and wrong answers.
McGill University
Removing Outliers
This site discusses the topic of removing outliers and how the configurations are done.
National Council of Teachers of Mathematics
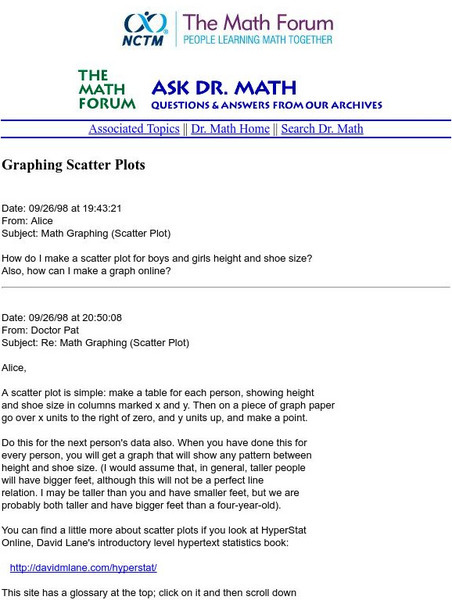
The Math Forum: Nctm: Ask Dr. Math: Graphing Scatter Plots
This page is in response to a question that someone emailed Dr. Math. It shows how to make a scatter plot for peoples' height and shoe sizes. The information is somewhat brief, but worth checking out on the subject.
National Council of Teachers of Mathematics
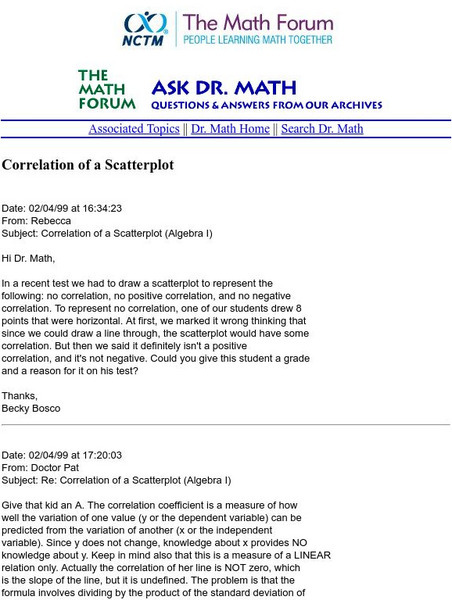
The Math Forum: Nctm: Ask Dr. Math: Correlation of a Scatterplot
This page from Ask Dr. Math describes the correlation of a scatterplot and gives an example of one with no correlation.
National Council of Teachers of Mathematics
Nctm: Figure This: How Many Fish in the Pond?
Can you figure out how many fish are in a pond? Use the statistical method of capture-recapture and estimation to solve this math challenge. An investigation from the NCTM Math Challenges for Families series. Discover how this skill can...
University of Illinois
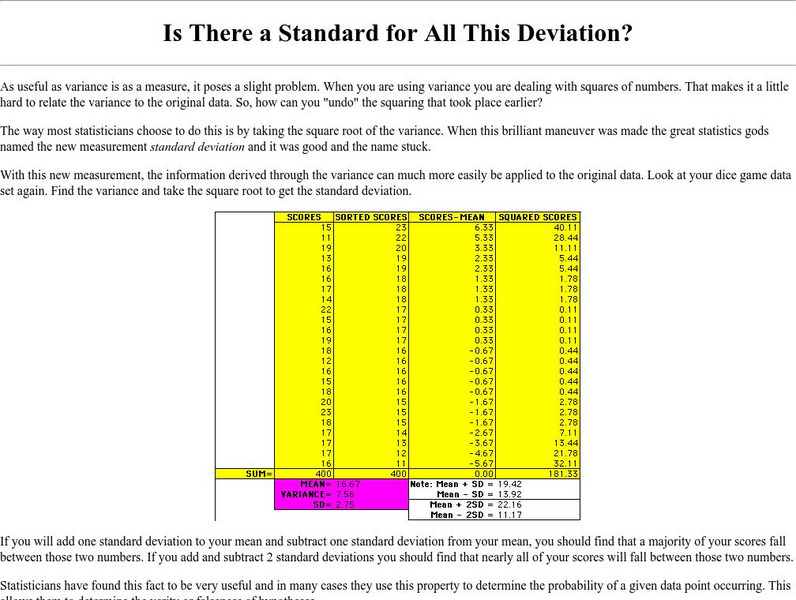
University of Illinois: Mste: Is There a Standard for All This Deviation?
Site contains information on the statistical term standard deviation. It gives a definition and shows how to calculate it. It has a link to information on the absolute value of a deviation and how the topics are related.
University of Illinois
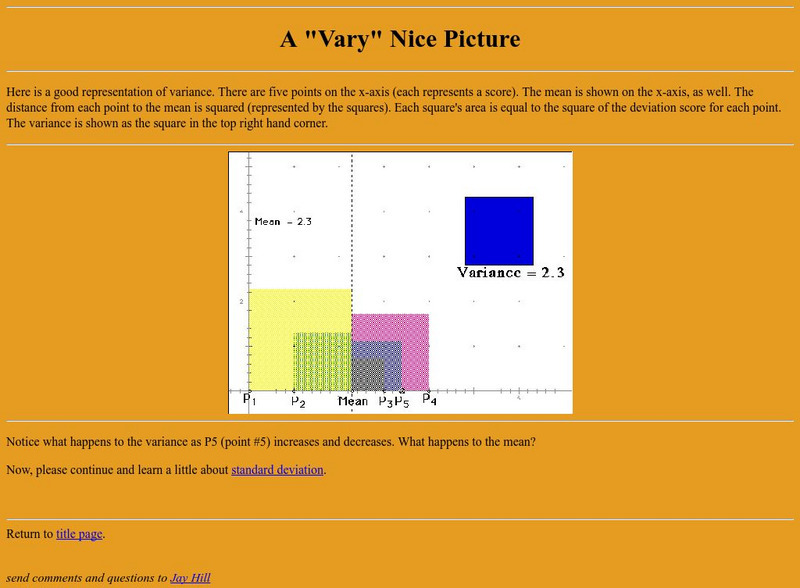
University of Illinois: A "Vary" Nice Picture
Site from the University of Illinois contains a graphical representation of variance. A follow-up question for the user and a link to standard deviation - a related statistical topic - are also provided.
Shmoop University
Shmoop: Basic Statistics and Probability: Histograms
Students learn about histograms. Examples are included, as well as a video. [1:16]
AAA Math
Aaa Math: Statistical Mean
Learn about finding the statistical mean of a set of data, and then do some practice problems.
AAA Math
Aaa Math: Statistical Range Ii
Learn how to find the range of a set of data, and then follow up with some practice problems.
Varsity Tutors
Varsity Tutors: Hotmath: Algebra Review: Range of Data
Find a quick, concise explanation of what a data range is. An example is given and clearly explained.


