Hi, what do you want to do?
Texas A&M University
Wtamu Virtual Math Lab: Beginning Agebra: Central Tendencies
A tutorial to understand the three central tendencies and how to find them, as well as the standard deviation of values. Offers a discussion and practice problems.
Khan Academy
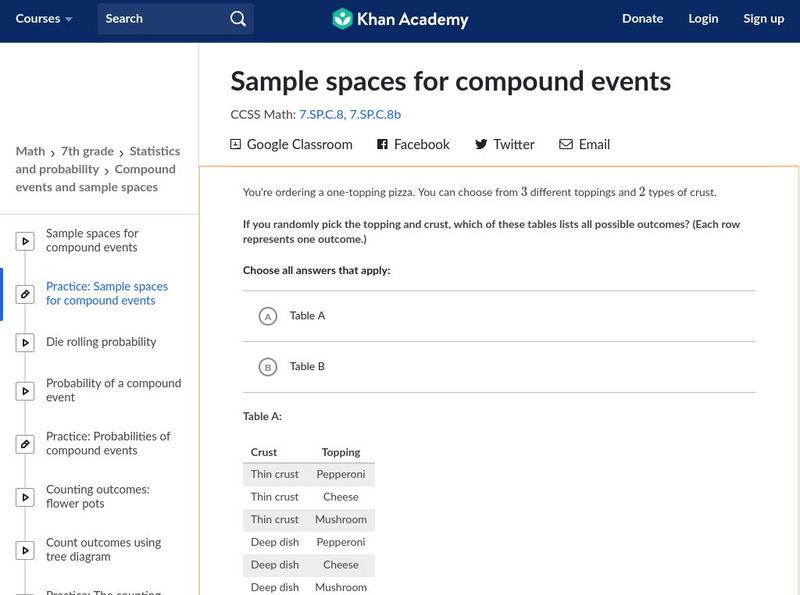
Khan Academy: Sample Spaces for Compound Events
Practice interpreting diagrams and sample spaces to find the probability of outcomes.
Khan Academy
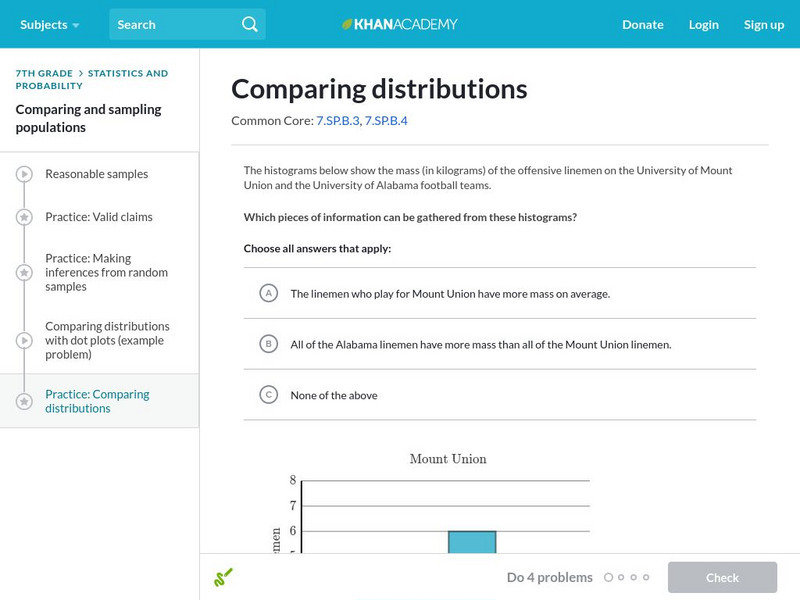
Khan Academy: Comparing Distributions
Try these practice problems comparing distributions.
Palomar Community College District
Palomar College: Mode, Median, Mean Examples
A series of step-by-step worked problems demonstrating how to take a set of data and produce the measures of central tendency. Hints are provided along the way and the final measures are shown for the user to check.
Other
Statistics Education Web: Bubble Trouble [Pdf]
Use random sampling to formulate, collect, and compare data from two populations. Written by Peter Banwarth of Oregon State University.
Beacon Learning Center
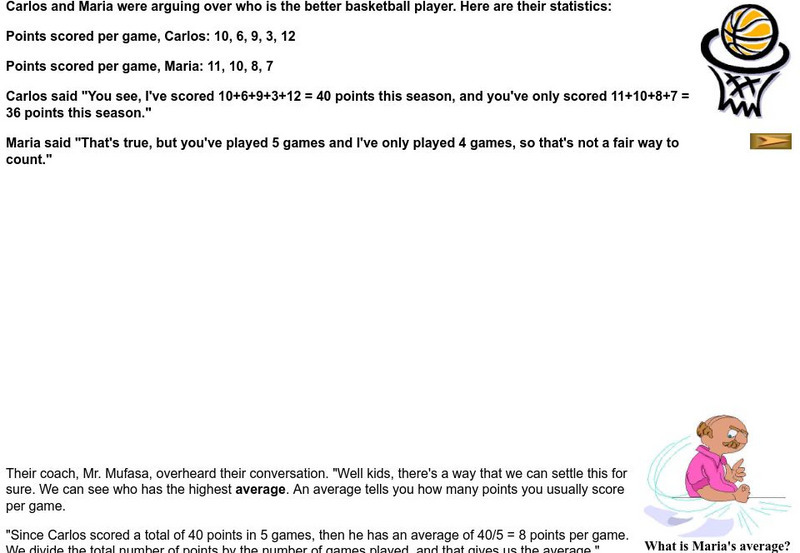
Beacon Learning Center: Basketball Means
Students explore and practice calculating averages in this interactive web lesson.
National Council of Teachers of Mathematics
Nctm: Illuminations: Mean and Median
This applet allows the user to investigate the mean, median, and box-and-whisker plot for a set of data that they create.
Shodor Education Foundation
Shodor Interactivate: Measures
Enter data and view the mean, median, variance, and standard deviation of the data set.
Cuemath
Cuemath: Average
A comprehensive guide for learning all about averages with definitions, uses, how to calculate it, , solved examples, and practice questions.
Quia
Ixl Learning: Interquartile Range
Brush up on your math skills relating to interquartile range then try some practice problems to test your understanding.
National Council of Teachers of Mathematics
Nctm: Comparing Properties of the Mean and Median
Through the use of technology, students can investigate how the mean and median of a set of date compares when values the data changes.
Other
Northern Michigan University: Line Plots
The author utilizes a line plot to demonstrate what an "outlier" is, what "clusters" are, and what "gaps" are.
McGraw Hill
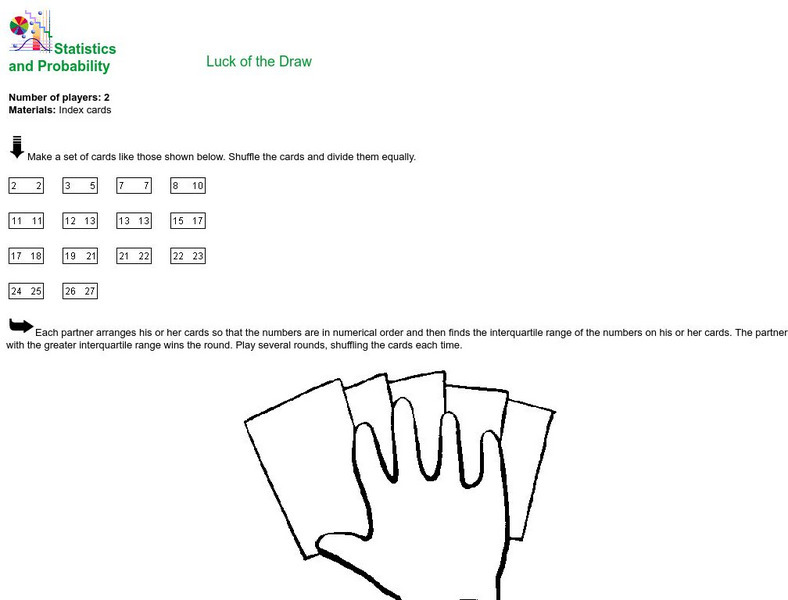
Mc Graw Hill Education: Glencoe: Statistics and Probability: Luck of the Draw
Instructions for creating and playing a simple card game through which students can practice calculating the interquartile range from a set of numbers.
Soft Schools
Soft Schools: Outliers
On this websites students explore the concept of outliers. Students are given several data sets and investigate how outliers can effect the mean and median of a data set.
Free Math Help
Free Math Help: Median
Students learn how to find the median of a dataset. The tutorial consists of a definition and example.
Teachnology
Teachnology: Teacher Guide to Probability and Statistics
Statistics Theme provides a collection of free sample worksheets, teacher resources, lesson plans and interactive media for grades k-12.
Shmoop University
Shmoop: Basic Statistics & Probability: Box & Whisker Plots
Students learn about box and whisker plots. Notes, examples, and practice exercises are included in the statistics resource.
Shmoop University
Shmoop: Basic Statistics & Probability: Scatter Plots & Correlation
The statistics resource explores scatter plots and correlation. Students learn about the concepts through notes and detailed examples. The resource consists of practice exercises to check for comprehension of the topics.
McGill University
Removing Outliers
This site discusses the topic of removing outliers and how the configurations are done.
University of Illinois
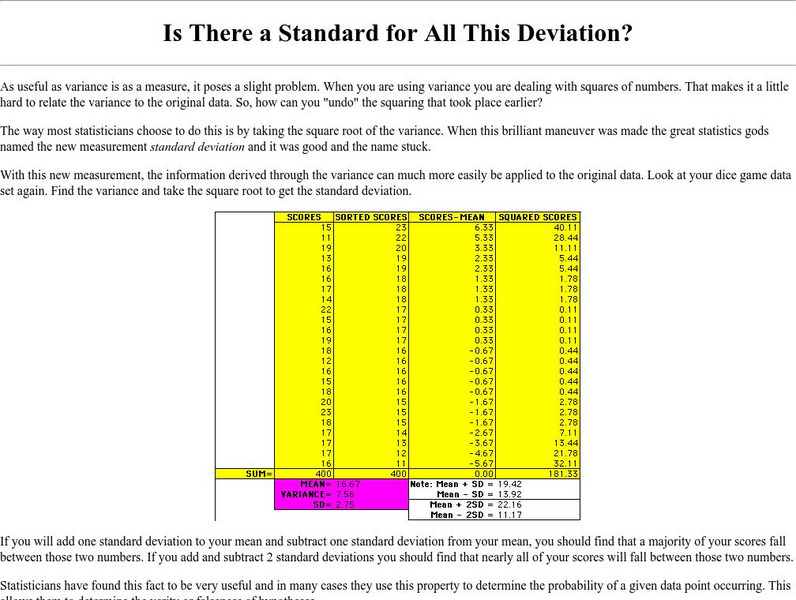
University of Illinois: Mste: Is There a Standard for All This Deviation?
Site contains information on the statistical term standard deviation. It gives a definition and shows how to calculate it. It has a link to information on the absolute value of a deviation and how the topics are related.
University of Illinois
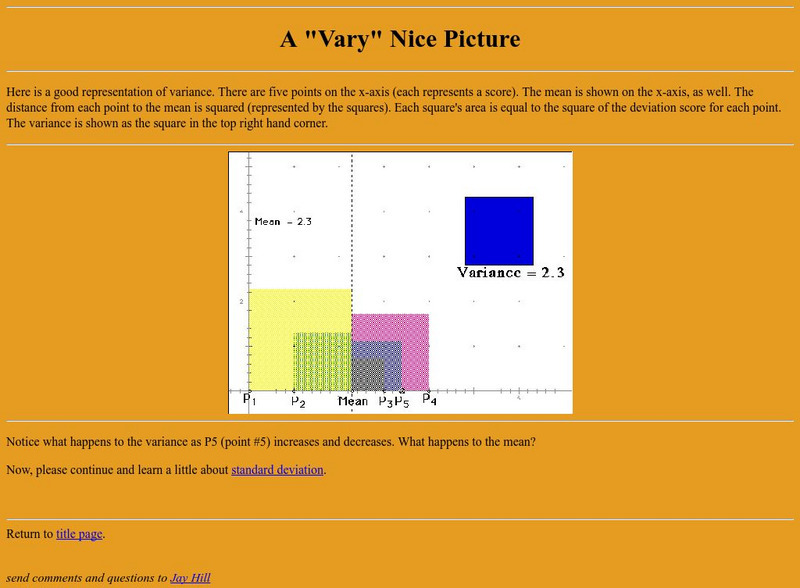
University of Illinois: A "Vary" Nice Picture
Site from the University of Illinois contains a graphical representation of variance. A follow-up question for the user and a link to standard deviation - a related statistical topic - are also provided.
Shmoop University
Shmoop: Basic Statistics and Probability: Histograms
Students learn about histograms. Examples are included, as well as a video. [1:16]
Education Place
Houghton Mifflin: Eduplace: Math Steps: What Is It? Data
This is a great place for lesson information on the concept of analyzing data - measures of central tendency. Three other tabs are available besides the "What Is It?" link. Tips and Tricks, When Students Ask, and Lesson Ideas also...
Varsity Tutors
Varsity Tutors: Hotmath: Algebra Review: Range of Data
Find a quick, concise explanation of what a data range is. An example is given and clearly explained.



![Statistics Education Web: Bubble Trouble [Pdf] Lesson Plan Statistics Education Web: Bubble Trouble [Pdf] Lesson Plan](https://content.lessonplanet.com/knovation/original/715465-988c4be74f96df36c2d9bcb6f2f5182f.jpg?1661829195)
