PBS
Pbs Learning Media: Real Life Math: Baseball
Watch and listen as the assistant general manager of a major league baseball team explains how he uses math in this video from KAET, Arizona PBS. A lesson plan and handouts are included. [7:43]
Sophia Learning
Sophia: The Effects of Outliers on Centers of Measure
Explore the effects of outliers on mean, median, and mode.
Math Mammoth
Math Mammoth: Mean, Median, and Mode: Measures of Central Tendency
In this lesson, students learn about measures of central tendency and how the mean, median, and mode work in different contexts. [9:25]
Virtual Nerd
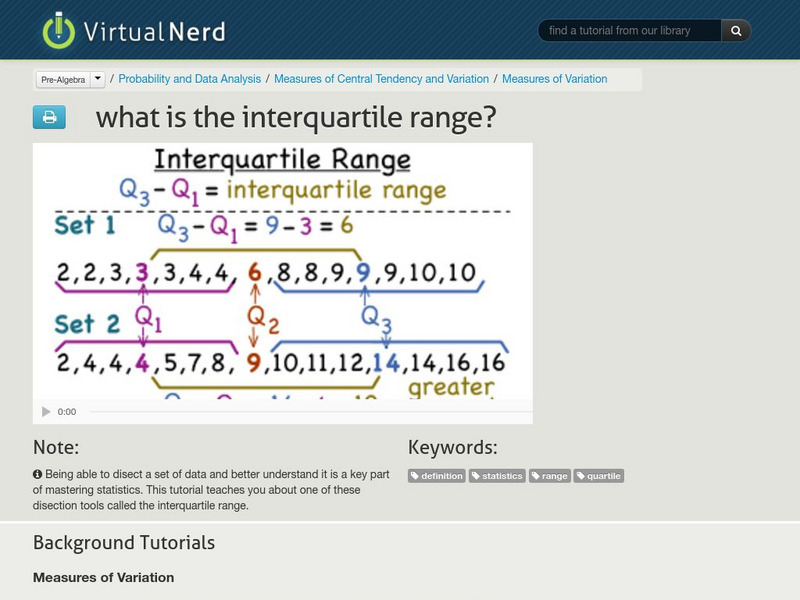
Virtual Nerd: What Is the Interquartile Range?
This tutorial teaches about one of the ways to dissect a set of data called the interquartile range. [4:34]
Sophia Learning
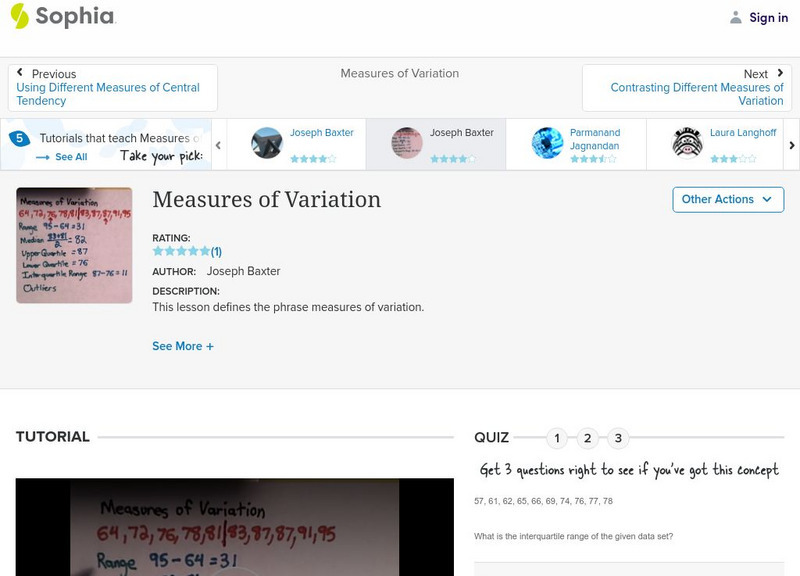
Sophia: Measures of Variation
Use data sets to determine the measures of variation. Check understanding with a quiz.
Math Mammoth
Math Mammoth: Measures of Statistical Variation: A Beginner Lesson
A lesson in how to calculate measures of variation, including the range, the interquartile range, and the mean absolute deviation, and what each of these terms mean. [9:59]
Khan Academy
Khan Academy: Estimating the Line of Best Fit
In this video lesson, students estimate the line of best fit from a scatter plot. [1:16]
Math Mammoth
Math Mammoth: Comparing Two Populations
In this lesson the heights of two basketball teams are compared using histograms. The means are compared and the difference between the means is compared to the mean absolute deviation. [6:57]
Sophia Learning
Sophia: Z Score Charts
This lesson shows how charts can be used to determine and list Z-scores.
Sophia Learning
Sophia: Z Score Charts
This lesson shows how charts can be used to determine and list Z-scores.
Sophia Learning
Sophia: Z Score Charts
This lesson shows how charts can be used to determine and list Z-scores.
Sophia Learning
Sophia: Z Score Charts
This lesson shows how charts can be used to determine and list Z-scores.
Sophia Learning
Sophia: Z Scores
In this lesson, students are introduced to Z-scores and their relevance to variance and distribution in data sets.
Sophia Learning
Sophia: Z Scores
In this lesson, students are introduced to Z-scores and their relevance to variance and distribution in data sets.
Sophia Learning
Sophia: Z Test for Population Means
Calculate z-statistic of a population mean. [9:44]
Sophia Learning
Sophia: Application of Mixture Problems
Here we look at a word problem related to mixture problems.
Sophia Learning
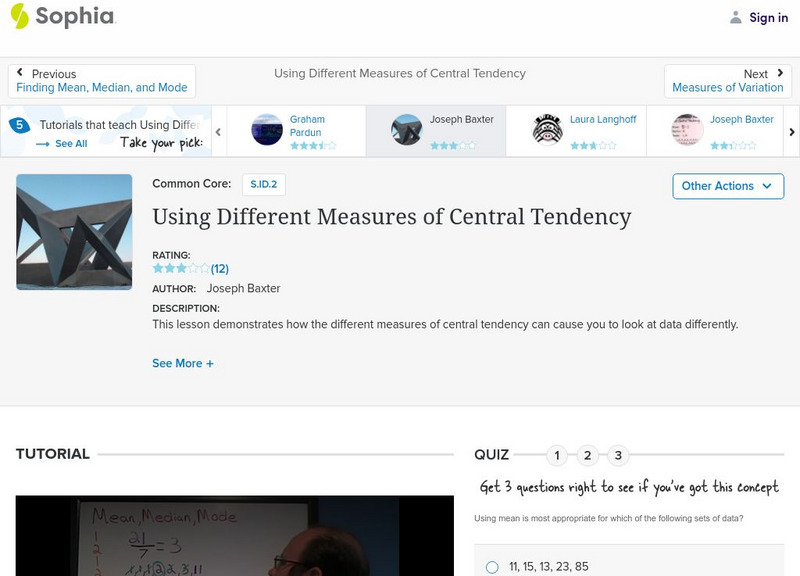
Sophia: Using Different Measures of Central Tendency
This lesson demonstrates how the different measures of central tendency can cause you to look at data differently.
Sophia Learning
Sophia: Using Different Measures of Central Tendency
This lesson demonstrates how the different measures of central tendency can cause you to look at data differently.
Sophia Learning
Sophia: Measure of Center: Lesson 2
This lesson will explain which measure of center to use. It is 2 of 3 in the series titled "Measure of Center."
Sophia Learning
Sophia: Measure of Center: Lesson 3
This lesson will explain which measure of center to use. It is 3 of 3 in the series titled "Measure of Center."
Sophia Learning
Sophia: Measure of Center: Lesson 1
This lesson will explain which measure of center to use. It is 1 of 3 in the series titled "Measure of Center."


