Hi, what do you want to do?
Curated OER
FCAT Real World Solving Linear Equations/Systems
Pupils relate real life situation to the equations, graphs and inequalities. They model real life scenarios using matrices and draw conclusions from their data. This lesson plan is aligned with FCAT.
Curated OER
To the Moon
Pupils explore circumference manipulating Moon Pie wrapper. In this geometry lesson plan, they manipulate snack wrappers to find circumference, diameter, radius and distance.
Curated OER
Curve Fitting
Pupils investigate linear, quadratic, and exponential regressions. They plot sets of data points, determine the regression equation that best fits the data and lastly investigate the coefficient of determination.
Curated OER
Circles all Around
Students investigate circles. In this middle school mathematics lesson, students explore the relationship between the diameter of a circle and its circumference.
Curated OER
Guess the Ages
Learners explore scatter plots in this algebra activity. They create a scatter plot from their guesses regarding a famous person’s birth date and the actual birth date then they examine and interpret the results of their graph.
Curated OER
Curve Ball
Learners explore the concept of parabolas by collecting quadratic data on a bouncing ball as it is falling using a motion detector. They plot the data and determine the equation of the quadratic in vertex form, then determine the values...
Alabama Learning Exchange
The State Capital of Stem and Leaf
Students explore the concept of stem and leaf plots. In this stem and leaf plots lesson, students plot the 50 US states' capitals on a stem and leaf plot according to the first letter of each state. Students compare...
University of South Florida
Fcat: Shaq's Hand/foot Span: Teacher Notes
Students compare their own hand/foot span to Shaquille O'Neal's, then graph the data & construct a best-fit line. They can then use the information to investigate the proportionality of the human body.
University of South Florida
Fcat: View Tubes: Teacher Notes
In this online activity use view tubes to collect data and determine the linear relationship and line of best fit.
University of South Florida
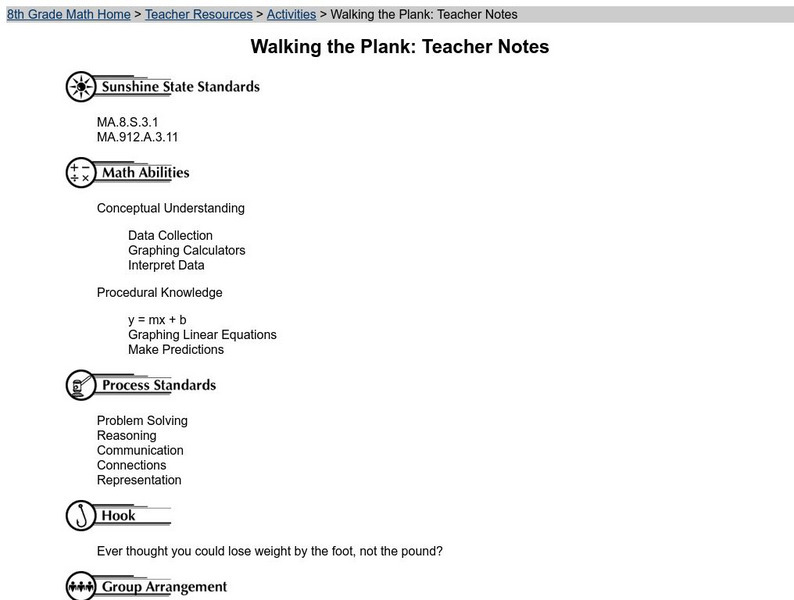
Florida Center for Instructional Tech: Walking the Plank
Students use weight to collect data and investigate the linear relationship. This activity uses a graphing calculator.
Google
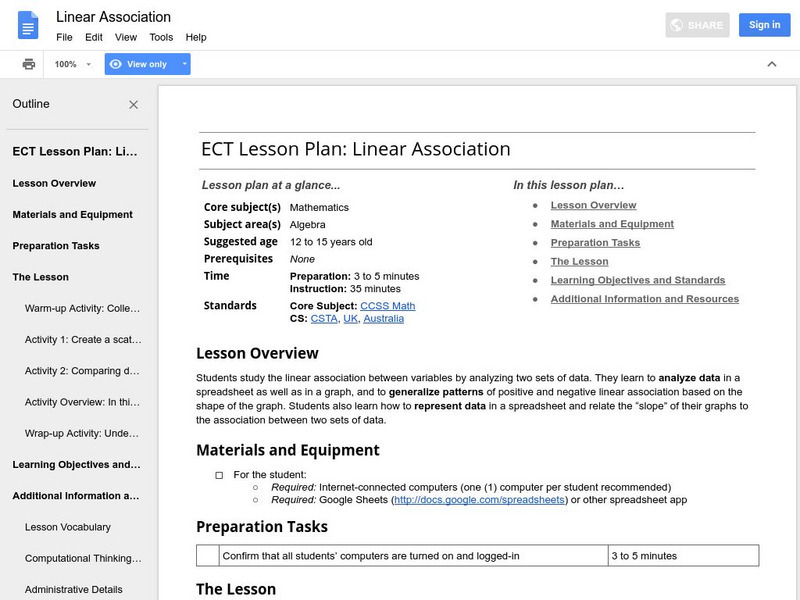
Google for Education: Linear Association
This student activity allows for practice in graphing data in a spreadsheet and relate the "slope" of their graphs to the association between two sets of data.
University of Colorado
University of Colorado: Ph Et Interactive Simulations: Least Squares Regression
Create your own scatter plot or use real-world data and try to fit a line to it. Explore how individual data points affect the correlation coefficient and best-fit line.
Oswego City School District
Regents Exam Prep Center: Scatter Plots and Line of Best Fit
Use this lesson, practice exercise, and teacher resource in planning instruction on scatter plots and line of best fit. In the lessons, you'll find definitions and examples of ways to make a scatter plot, determine correlations, and find...
Texas Education Agency
Texas Gateway: Analyzing Scatterplots
Given a set of data, the student will be able to generate a scatterplot, determine whether the data are linear or non-linear, describe an association between the two variables, and use a trend line to make predictions for data with a...
Cuemath
Cuemath: Linear Graph
A comprehensive guide for learning all about linear graphs with definitions, properties, their equations, how to plot or analyze them, solved examples, and practice questions.
Cuemath
Cuemath: Scatter Plot
A comprehensive guide for learning all about scatter plots with definitions, how to construct and solve them, types of scatter plots, solved examples, and practice questions.
Houghton Mifflin Harcourt
Holt, Rinehart and Winston: Homework Help Independent Practice: Scatter Plots
Get independent practice working with scatter plots. Each incorrect response gets a text box explanation and another try. Correct responses are confirmed.
Duke University
Duke University: Introduction to Linear Regression
This page discusses linear regression, its equations, background, and applications. Provides questions, answers, formulas, and explanations for understanding.
University of Regina (Canada)
University of Regina: Math Central: Scatter Plots
Three different concepts are examined about scatter plots. Topics featured are collecting data, analyzing scatter plots, and determining a line of "best fit". The lesson plan has an overview, material, procedures, and evaluation techniques.
University of Regina (Canada)
University of Regina: Math Central: Scatter Plots
Three different concepts are examined about scatter plots. Topics featured are collecting data, analyzing scatter plots, and determining a line of "best fit". The lesson has an overview, material, procedures, and evaluation techniques.
University of South Florida
Florida Center for Instructional Tech: Famous People
Students estimate the ages of famous people, then create a scatterplot with the actual ages. This activity allows them to estimate with linear equations. You can access the age data through the "activity" link.
Shodor Education Foundation
Shodor Interactivate: Interactive: Scatter Plot
Use this interactive applet to input a series of (x, y) ordered pairs and plot them. Parameters such as minimum and maximum value, minimum and maximum y value, and x- and y-scale can be set by the user or determined by the applet.
Texas Instruments
Texas Instruments: Scatter Plots
Basic activity of collecting data and graphing sets of data to see if there is a relationship.
Texas Instruments
Texas Instruments: Birthday Scatter Plot
Students will be able to interpret a scatter plot to see if there is a relationship between the two variables.


