Virtual Nerd
Virtual Nerd: What Is a Histogram?
Take a look at this video tutorial for information on histograms. [5:23]
Virtual Nerd
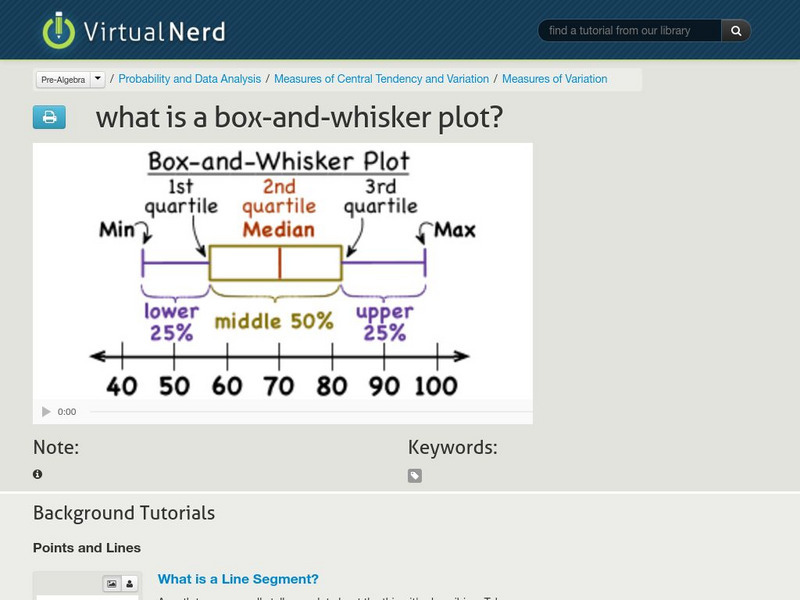
Virtual Nerd: What Is a Box and Whisker Plot?
View this video tutorial to learn about box-and-whisker plots. [5:36]
Imagine Learning Classroom
Learn Zillion: Create a Dot Plot
In this lesson, you will learn how to represent data on a number line by creating a dot plot. [3:49]
Imagine Learning Classroom
Learn Zillion: Create a Histogram
In this lesson, you will learn how to represent data on a number line by creating a histogram. [4:44]
PatrickJMT
Patrick Jmt: Box and Whisker Plot
Easy to understand video tutorial explores how to make a box and whisker plot. [5:53]
Khan Academy
Khan Academy: Statistics: Reading Box and Whisker Plots
Video demonstration of reading a box-and-whisker plot to find the range, median and quartiles and to answer a question. [3:18]
Khan Academy
Khan Academy: Algebra: Fitting a Line to Data
This video utilizes Microsoft Excel to demonstrate how to plot data in the form of a scatter plot and then create a line of best fit. It also shows how to make a prediction based on the linear progression of the data. The software does...
Khan Academy
Khan Academy: Algebra: Histograms
Video shows example of creating a histogram for data by first creating a frequency table. [6:08]
Khan Academy
Khan Academy: Box and Whisker Plots: Constructing a Box and Whisker Plot
Constructing a box and whisker plot to analyze data.
Bozeman Science
Bozeman Science: Graphing Data by Hand
Paul Andersen shows you how to graph data by hand. He explains the required elements of a scatter plot with a best fit line. He shows you how to properly scale and label the axes.
Sophia Learning
Sophia: Interpreting Box and Whisker Plots
This video lesson demonstrates how to interpret box-and-whisker plots to find outliers.


