Hi, what do you want to do?
Curated OER
Measures of Central Tendency Using Scientific Calculators
Learners explore mean, median, and mode as they model mathematics in real-world problem situations. The lesson requires the use of the TI 30X IIS.
101 Questions
Motivation to Run
Run headlong into a great resource. Young mathematicians explore the Nike+ app to see which measure of central tendency motivates runners the most. They use two screenshots of the app to help them make their determinations.
Curated OER
Flipping for a Grade
What happens when your teachers get tired of grading tests and want to use games of chance to determine your grade? How would you decide which game they should play? Learn how to use expected value and standard notation to compare two...
Georgia Department of Education
The Basketball Star
Have learners use math to prove they are sports stars! Assess a pupil's ability to create and analyze data using a variety of graphs. The class will be motivated by the association of math and basketball data.
Illustrative Mathematics
Accuracy of Carbon 14 Dating I
Here is an activity that is intended to highlight a very important issue about precision in reporting and understanding statements in a realistic scientific context. Discuss different ways of reporting the half life of Carbon 14...
Curated OER
Mean and Standard Deviation
Get two activities with one lesson plan. The first lesson plan, is appropriate for grades 6-12 and takes about 20 minutes. It introduces the concept of measures of central tendency, primarily the mean, and discusses its uses as well as...
Curated OER
Application and Modeling of Standard Deviation
The first activity in this resource has learners computing the mean and standard deviation of two different data sets and drawing conclusions based on their results. The second activity has them using a dice-rolling simulation to...
Illustrative Mathematics
Haircut Costs
Who pays more for haircuts, men or women? Given quartile values, learners construct box and whiskers plots and interpret the results. They compare the mean and median, and discuss which is more appropriate under particular conditions....
Illustrative Mathematics
Speed Trap
In which direction is traffic moving faster, north or south? Use box and whisker plots to organize data and interpret the results. Detailed solutions are included. This activity would be good as a warm up or quick assessment at the...
Wolfram Research
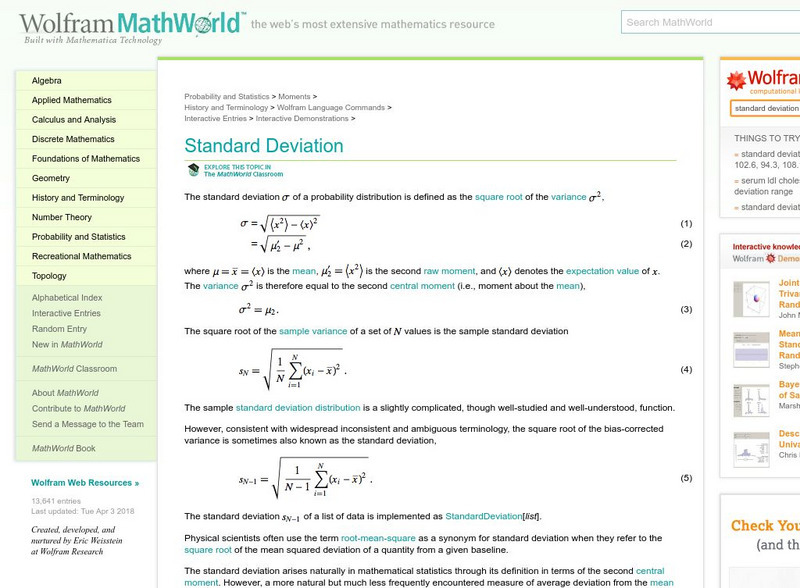
Wolfram Math World: Standard Deviation
This World of Mathematics site by Eric Weisstein explains the term "Standard deviation." Provides step-by-step help, examples, and charts.
Other
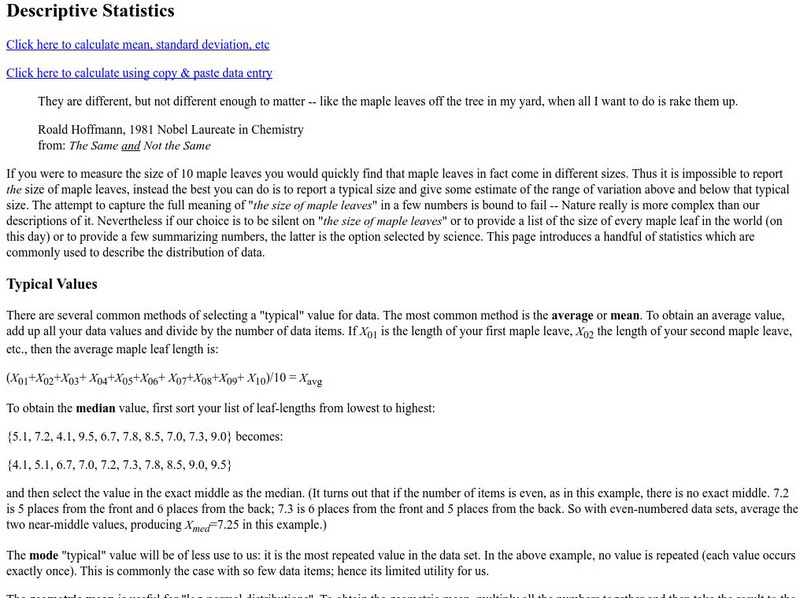
Descriptive Statistics
Very complete explanation of mean, standard deviation, etc. including an online calcluator for these statistics.
Google
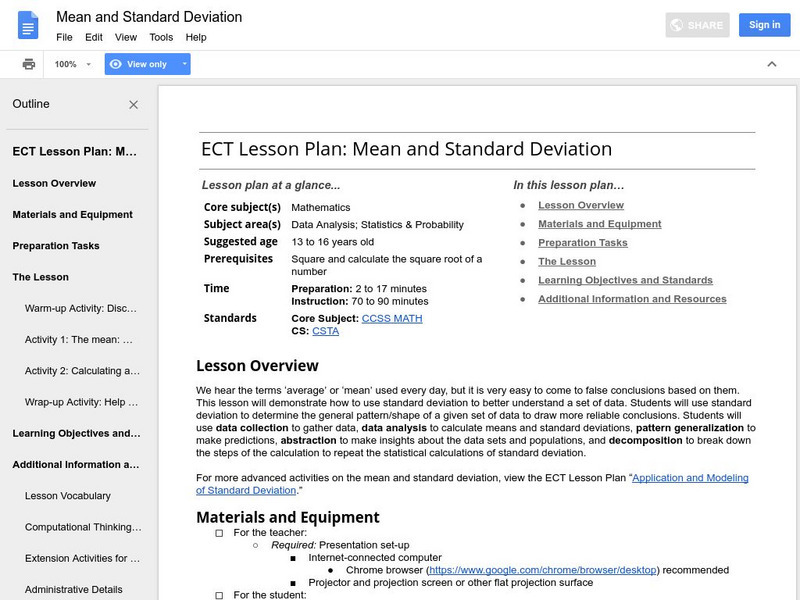
Google for Education: Mean and Standard Deviation
This lesson demonstrates to students how to use standard deviation to better understand a set of data. Students use standard deviation to determine the general pattern or shape of a given set of data to draw more reliable conclusions.
Vision Learning
Visionlearning: Statistics: Using Mean, Median, and Standard Deviation
An introduction to recognizing trends and relationships in data through descriptive statistics.
Missouri State University
Missouri State University: Introductory Statistics: The Normal Curve
Provides lengthy explanations of the measures of central tendencies - mean, mode, and median - and the measures of variability - range, variance, standard deviation - are given here. Graphs of interesting "side items" are presented as...
Missouri State University
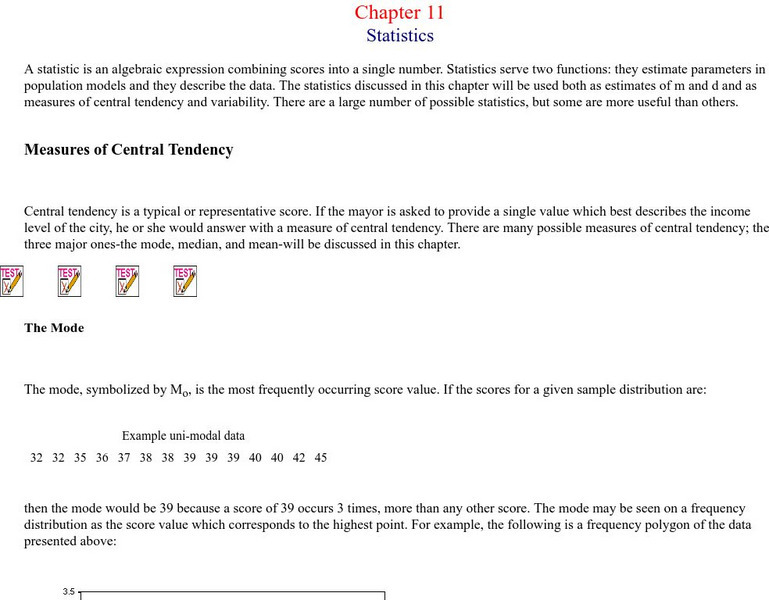
Missouri State U.: Statistics: Measures of Central Tendency and Variability
Provides lengthy explanations of the measures of central tendency - mean, mode, and median - and the measures of variability - range, variance, standard deviation. Graphs of interesting examples are presented as well, skewed...
CK-12 Foundation
Ck 12: Statistics: Normal Distributions Advanced
[Free Registration/Login may be required to access all resource tools.] This concept introduces students to the standard normal probability distribution.
CK-12 Foundation
Ck 12: Interactive Algebra 1 for Ccss
This is a complete, full-year Algebra 1 course with interactivity included in every lesson. Some lessons include videos, and all include interactives and inline questions that offer instant, per-answer feedback. Every lesson also has...
Thinkport Education
Thinkport: Algebra Ii: Standard Deviation
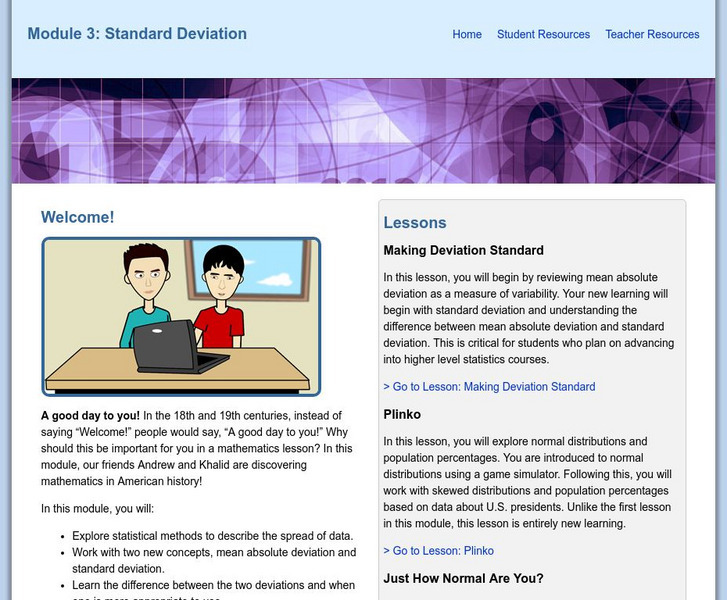
Begin by reviewing mean absolute deviation as a measure of variability. Your new learning will begin with standard deviation and understanding the difference between mean absolute deviation and standard deviation.
City University of New York
Measures of Variability
Explanation and examples of variance and standard deviation. Helpful charts and formulas are provided.
Wolfram Research
Wolfram Math World: Variance
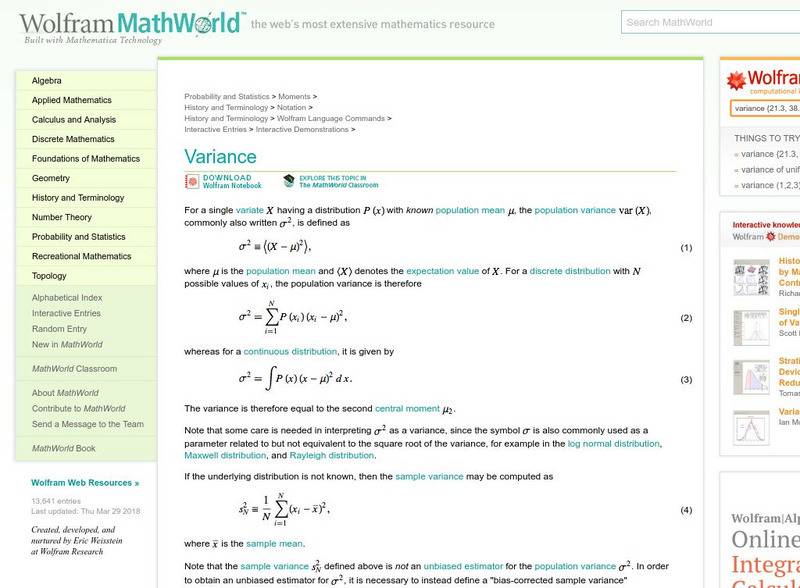
MathWorld offers a plethora of information on variance. Student should have some statistic knowledge to use this site. This site contains links to related topics.
Texas Instruments
Texas Instruments: How Close Is Close?
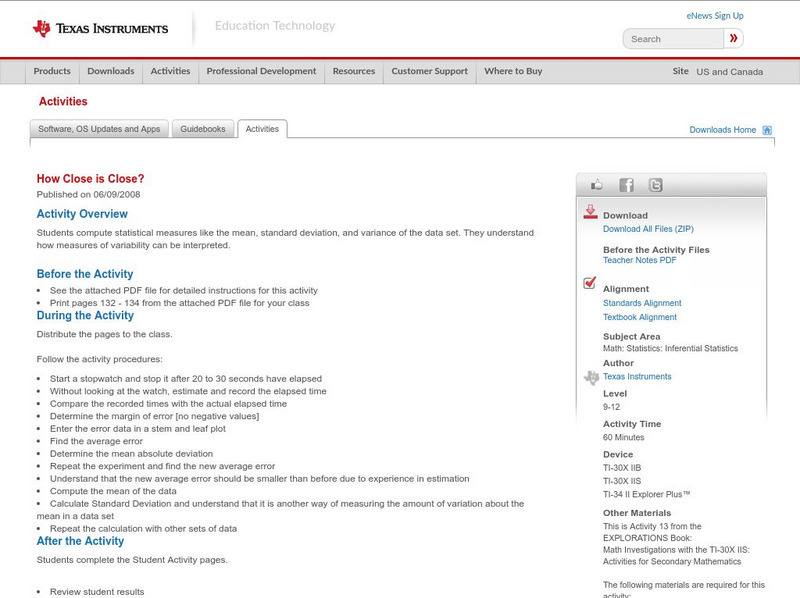
In this activity, students compute statistical measures like the mean, standard deviation, and variance of the data set. They understand how measures of variability can be interpreted.
Texas Instruments
Texas Instruments: Simulation of Sampling Distributions
This set contains questions about simulating sampling distributions. Students see graphs of simulated distributions enabling them to reach conclusions about mean, shape, and standard deviation.
Stefan Warner and Steven R. Costenoble
Finite Mathematics & Applied Calculus: Variance and Standard Deviation of a Set of Scores
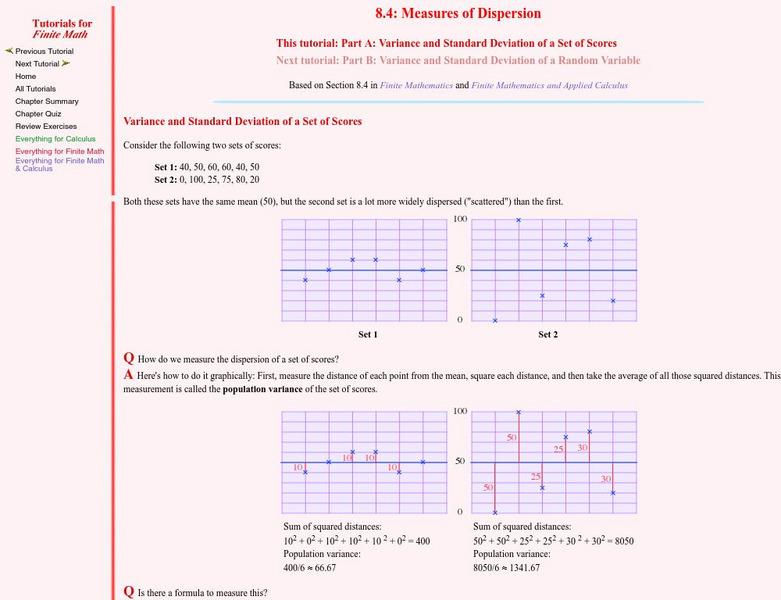
Students learn about the variance and standard deviation of a set of scores. Topics explored are the empirical rule and Chebyshev's rule. The tutorial investigates the statistics concepts through class notes and examples. Review...
Stefan Warner and Steven R. Costenoble
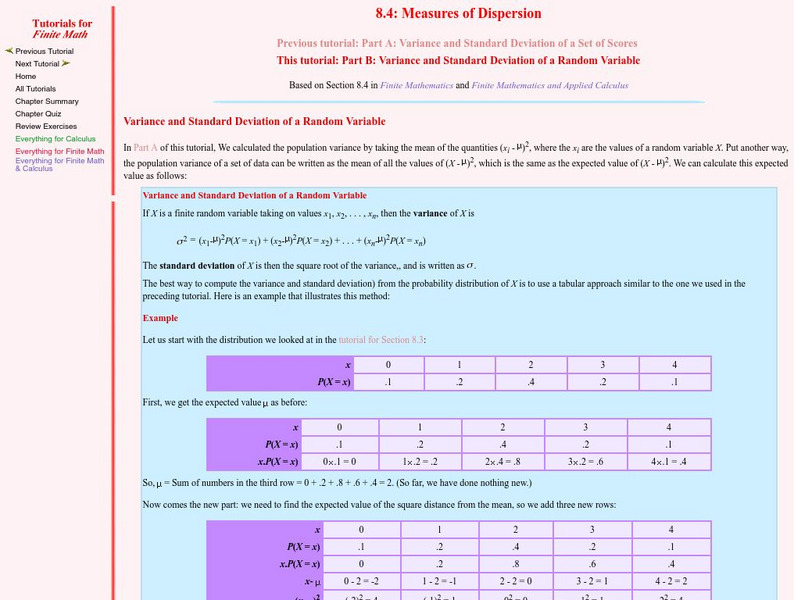
Finite Mathematics & Applied Calculus: Variance and Standard Deviation of a Random Variable
Students learn about the variance and standard deviation of a random variable. The tutorial investigates the statistics concepts through class notes and examples. Review exercises and a chapter quiz are included.


