Curated OER
Meatiest States: Graph Problem Solving
In this graph problem solving worksheet, students analyze a graph that shows commercial red meat production in five states. Students answer 5 word problems using the data on the graph.
Curated OER
Survey and Share
Students practice collecting data by surveying other students. In this data collection lesson plan, students decide on a question and collects data from 15 other students. Eventually the students will end up graphing their results.
Curated OER
Graphing with the Five Senses
Students collect data and record it on a bar graph. In this data graphing lesson, each small group of students is assigned to collect data on one of the five senses. They then practice a song that helps them remember the purpose of each...
Curated OER
Use a Graph Reteach 4.8
For this graph worksheet, students solve 3 problems using a data table and bar graph. Students write number sentences to figure out answers to the questions about kinds of toys in a shop.
Curated OER
Heads & Tails Data Collection
In this data collection worksheet, students use a penny and a dime to play a math game. Students flip the money in the cup and then record the number of heads and tails showing marking the coins in the box.
Curated OER
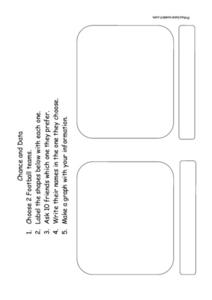
Chance and Data - Data Collection
In this data and probability worksheet, students choose two football teams and label the graphic organizer. They question 10 friends as to which team they prefer and write their names in the organizer. They make a graph that displays the...
Curated OER
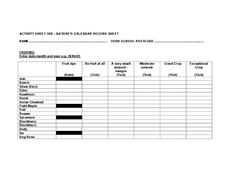
Nature's Calendar
In this fruiting worksheet, students document when different trees begin to have fruit and what kind of crop the tree gives for that year. This worksheet is a graphic organizer.
Curated OER
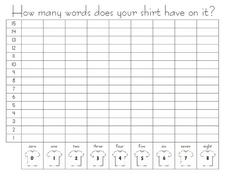
How Many Word Does Your Shirt Have on It? --class Bar Graph
In this math activity, students participate in a group bar graph activity. Students survey classmates about how many words, if any, are on their shirts. Results are plotted on a bar graph.
Curated OER
Lake Pepperidge Farm
Students calculate proportions to determine the total population of Lake Pepperidge Farm. They collect a blind sample of fish and count the number of tagged and untagged fish. They collect data from all samples and record the data in a...
Curated OER
Antlion Pit Building Investigation
Students design and perform an experiment related to comparing and contrasting antlion pits. Given a set of parameters, students select a hypothesis and perform observations on antlion pits. They record data and use this date to support...
Curated OER
Our Animal Friends
Students use the internet to find information pertaining to the benefits of pets. They list their results on a database. They find and record data on the percent of households that own pets as well as the top six species of pets. Once...
Curated OER
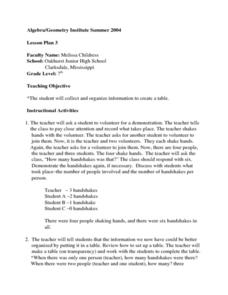
Creating a Data Table
Seventh graders explore organizing data into a table. The teacher leads a handshaking activity among the class. They collect the information concerning the number of handshakes each person received. Students discover a pattern. They...
Curated OER
Sleepy Time
students collect and interpret data about their own sleep patterns, as well as family members. Students graph their results and compare with others in the class. Students identify and interpret healthy sleep patterns and behaviors.
Curated OER
M&M Statistics
Students determine the difference between guessing and making a prediction. They discuss what they could graph using a bag of M&M's. They take a Raw data sample and convert it into a sample. They graph the actual results and combine...
Curated OER
Who Built It?
Seventh graders study the difference between architectural detail from the Romanesque and Gothic eras. The class participates in discussion on are in different eras. They predict what picture belongs in what era.
Curated OER
Technology - Data Collection
Students collect and analyze data from the United States Census Bureau. Using spreadsheet technology, students explore their results and make preductions about income groups. Students compute the mean, median and mode. They create...
Curated OER
Observing Fall Migrants
Students keep a detailed data collection log of the different types of monarch behavior. They track the weather conditions daily and link it to the migration of the monarchs. They summarize their data using either a graph or a computer...
Curated OER
Genetics Lesson
Students investigate the genetic nature of skeletons while collecting data from an Internet site. They read a case study on the Internet and complete the associated activity.
Curated OER
Let It Rain
Students study the effects of water erosion on soil by gathering and analyzing data during an experiment. They decide on appropriate units of measurement to apply in problem solving.
Curated OER
Work-Kinetic Energy Theorem
Students prove the validity of the Work-Kinetic Energy Theorem by analyzing the Car and Driver website which lists qualitative and quantitative data about an assigned car. They decide whether or not they would purchase the car based on...
Curated OER
Language Arts: Five Senses Walk
First graders take a discovery walk around the school. They use their observations to compose a class book about their school.
Curated OER
Making Your Own Sampling Tools
Students begin a class recycling project. They create data sampling equipment using their own designs and test them in the field.
Curated OER
Computing Mean, Mode and Median
Ninth graders collect data on basketball player's heights and determine the mean, median, and mode for the data.
Curated OER
Geometric Figures
Young scholars compare, classify and calculate the area of geometric figures such as rectangles, squares, circles and triangles.


