Scholastic
Scholastic: Bars, Lines, and Pies
Students will learn and reinforce skills for creating, applying and analyzing pie charts, bar graphs and line graphs.
BSCS Science Learning
Bscs: Asking and Answering Questions With Data
This inquiry is intended to provide students with practice developing investigable questions that need data, and specifically large datasets, to be answered. Click the teacher resources link for teaching guides and student handouts.
BSCS Science Learning
Bscs: Stocking Rivers With Trout
This inquiry looks at fish farming and the management of trout by state environmental resource specialists in Colorado. Students will practice working with data generated from a statewide citizen science project called River Watch of...
PBS
Pbs Learning Media: Decreasing Water Levels
The CyberSquad creates a line graph to help tell the story of the decreasing water levels in Sensible Flats in this video segment from Cyberchase.
PBS
Pbs Learning Media: Keeping Track of the New York City Marathoners
In this video segment from Cyberchase, Bianca figures out a way to count the thousands of runners in the New York City Marathon.
University of Georgia
University of Georgia: Definitions in Statistics
This site contains definitions to use in statistics and ways to collect data.
US Department of Labor
Bureau of Labor Statistics: Current Employment Statistics
This resource provides both long term and current national employment information and statistics.
National Council of Teachers of Mathematics
The Math Forum: Seventh Grade Mathematics: Data Sense
This site has some interesting ways to collect and evaluate data. There are some activities about note taking, spreadsheets, surveys, and a cool bridge construction project. Teachers may want to use this site as a resource for some...
University Corporation for Atmospheric Research
Ucar: Project Sky Math
Teachers will be interested to explore the SkyMath module, and the 16 classroom activities at this site. In this program, students will collect and record real-time weather data to analyze. Data analysis, graphing, number relationship,...
Beacon Learning Center
Beacon Learning Center: Kinds of Graphs
An interactive web lesson introduces five types of graphs to students and allows them to practice matching the names to examples.
The Math League
The Math League: Ratio and Proportion
This tutorial provides definitions and examples of ratios and proportions and features comparing ratios and converting rates.
Beacon Learning Center
Beacon Learning Center: All That Data 2
Students describe graphs and explore range, measures of central tendency, and distribution in this interactive web lesson.
Beacon Learning Center
Beacon Learning Center: All That Data
Students analyze data by finding the mean, median, mode, and range of a set of numbers. Line plots, bar graphs, and circle graphs are also included in this lesson.
Curated OER
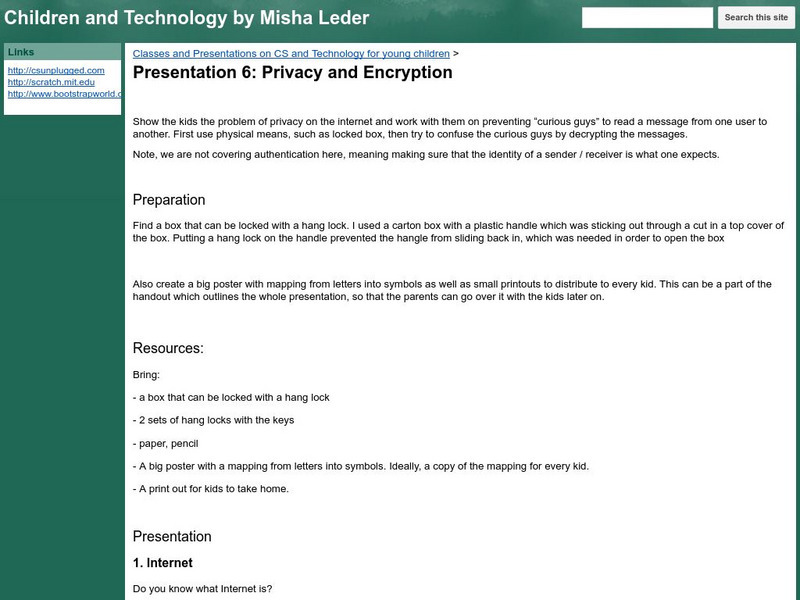
Google for Education: Children and Technology: Privacy and Encryption
Students simulate sending a secret message to a friend via the internet, attempting to deliver the message safely and securely.
Other
Whalenet: Home Page
An interacive educational website wich focuses on whales and marine research. There are special links for students, teachers, and the general public. Learn about certain whales, go on a tour, and more.
Other
How Encryption Works and How It Will Change Your Business
A thorough discussion of the business and professional uses of encryption.
Other
Journalist Express: Homepage
This site from Journalist Express lists more links than you could visit in a lifetime. This is another site to save for future reference.
Other
Science Fair Primer: Judging Guidelines
A five part set of standards (20 pts ea)of judging science fair prjects, with three to five criteria in each standard. These come from Falmouth High School.
Other
Data Guru: The Communication Process
This communication tutorial focuses on online communication in which interpretation can lead to conflict.
Other
Explore Learning: Rainfall and Bird Beaks
Explore how environmental conditions affect the adaptation of birds in this simulation. The amount of annual precipitation on an island is controlled by you while you track changes in the thickness of bird beaks over a five-year period....
McGraw Hill
Glencoe: Two Way Tables [Pdf]
This portion of an online textbook provides examples of two-way tables, vocabulary and practice problems.
University of Washington
Washington U: Model for Conducting Scientific Research
This page outlines the scientific method, step by step.
Scholastic
Scholastic: Study Jams! Science: Scientific Inquiry: Scientific Methods
A video that explains the steps involved in the scientific method. Includes a karaoke song with lyrics, a quiz to test students' knowledge, and vocabulary definitions.
Sophia Learning
Sophia: Types of Conflict: Lesson 6
At the end of this tutorial, the learner will understand the range of ways conflict can occur in the world. It is 6 of 7 in the series titled "Types of Conflict."


![Glencoe: Two Way Tables [Pdf] eBook Glencoe: Two Way Tables [Pdf] eBook](https://content.lessonplanet.com/knovation/original/108238-00003273f53572e51290174e1a53eb12.jpg?1661187814)

