CK-12 Foundation
Ck 12: Frequency Tables to Organize and Display Data Grade 7
[Free Registration/Login may be required to access all resource tools.] Make a frequency table to organize and display data.
CK-12 Foundation
Ck 12: Statistics: Histograms Grade 7
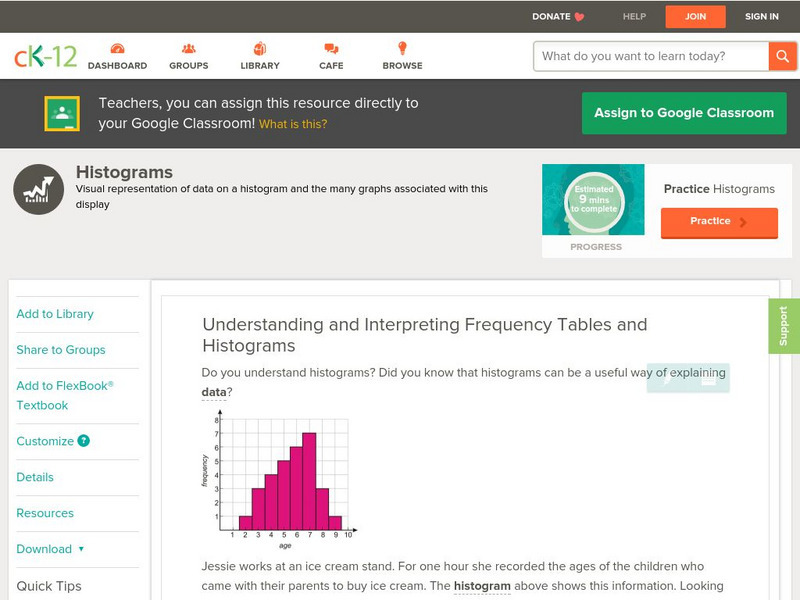
[Free Registration/Login may be required to access all resource tools.] Make a histogram given a frequency table.
CK-12 Foundation
Ck 12: Statistics: Line Graphs Grade 7
[Free Registration/Login may be required to access all resource tools.] Make a line graph to display data over time.
CK-12 Foundation
Ck 12: Statistics: Mean
[Free Registration/Login may be required to access all resource tools.] Find the mean of a set of data.
CK-12 Foundation
Ck 12: Statistics: Median Grade 7
[Free Registration/Login may be required to access all resource tools.] Find the median of a set of data.
CK-12 Foundation
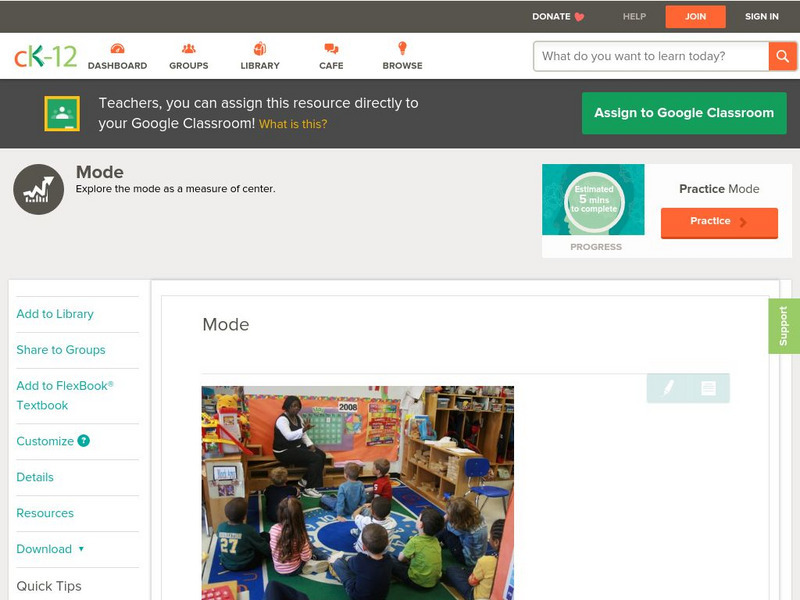
Ck 12: Statistics: Mode Grade 7
[Free Registration/Login may be required to access all resource tools.] Find the mode of a set of data.
CK-12 Foundation
Ck 12: Statistics: Multiple Bar Graphs Grades 6 7
[Free Registration/Login may be required to access all resource tools.] Create multiple bar graphs to display and compare given data.
CK-12 Foundation
Ck 12: Statistics: Multiple Bar Graphs Grade 7
[Free Registration/Login may be required to access all resource tools.] Make multiple bar graphs to display and compare data.
CK-12 Foundation
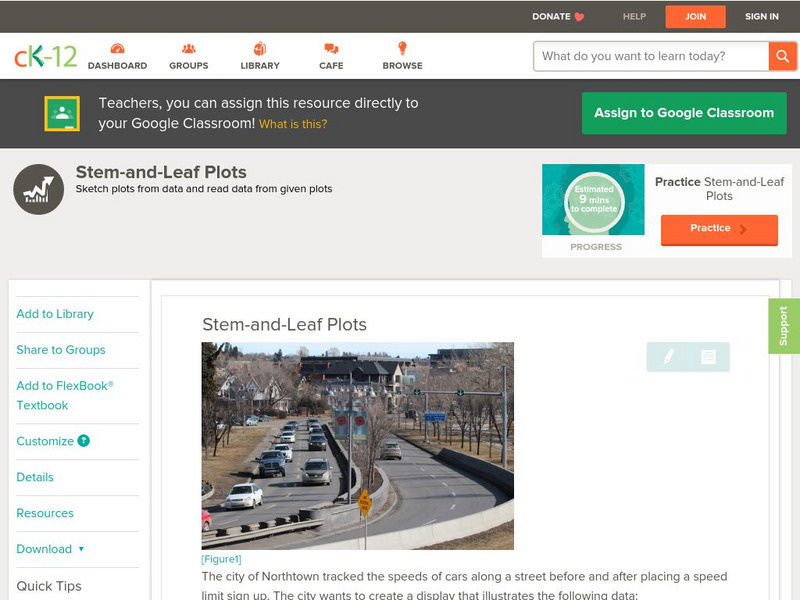
Ck 12: Statistics: Stem and Leaf Plots Grade 6
[Free Registration/Login may be required to access all resource tools.] Organize a given set of data in a stem-and-leaf plot.
American Geosciences Institute
American Geosciences Institute: Earth Science Week: Sky and Cloud Windows
In this activity, students will conduct experiments or participate in demonstrations to answer questions about sky and weather phenomena.
CPALMS
Florida State University Cpalms: Florida Students: Scientific Laws and Theories
Differentiate between scientific laws and theories. Identify examples of scientific theories and use evidence to support them.
Other
Maths Zone
A huge collection of math online games for all ages. Access different types of math such as: use and apply, count and understand, addition and subtraction number facts, multiplication and division number facts, shapes, measuring, and...
Cornell Lab of Ornithology
Habitat Network: The Great Backyard Bird Count Group
Show off a local wonderful habitat by joining the Great-Backyard-Bird-Count group, and put the bird count data on your map.
Discovery Education
Discovery Education: Web Math: Using a Number Line
This WebMath site provides an interactive number line "solver." Content includes helpful hint and a full explanation of the mathematical solution.
Read Works
Read Works:north America:comparing Data From Different Countries Around the World
[Free Registration/Login Required] A chart with land and population data from Canada, the United States of America, the United Kingdom, and Japan. A question sheet is available to help students build skills in reading comprehension.
CK-12 Foundation
Ck 12: Statistics: Stem and Leaf Plots, Range of a Data Set
[Free Registration/Login may be required to access all resource tools.] Find the range of a set of data displayed in a stem-and-leaf plot.
American Geosciences Institute
American Geosciences Institute: What Are Weather Observations?
Find out why meteorologists need weather observations to accurately measure and predict the weather.
Utah Education Network
Uen: 1st Grade Act. 04: Chrysanthemum and Letter Tiles
In this instructional activity, students will engage in shared reading with the Kevin Henkes' book, Chrysanthemum. Then students will engage in a letter tiles activity that requires them to compare the length of their own names with the...
Utah Education Network
Uen: 1st Grade Act. 03: T Shirt Glyph
During this mini-unit, students will develop a t-shirt with a glyph that represents their own personalities. Then students will read the glyphs of others using a legend to understand the data on the glyphs.
CK-12 Foundation
Ck 12: Statistics: Histograms Grade 8
[Free Registration/Login may be required to access all resource tools.] Students will interpret frequency tables and connect data to histograms.
CK-12 Foundation
Ck 12: Statistics: Mean Grades 9 10
[Free Registration/Login may be required to access all resource tools.] Find the mean of a set of data.
CK-12 Foundation
Ck 12: Statistics: Multiple Line Graphs
[Free Registration/Login may be required to access all resource tools.] Make multiple line graphs to display and compare given data.
Other
Webopedia: Tape
Resource offers several paragraphs of information on tapes, which are magnetically coated strips of plastic on which data can be encoded.
Scholastic
Scholastic: Study Jams! Math: Data Analysis: Line Plots
Explore how to organize and plot data on a line plot by going step by step through the activity. Then test your knowledge to check for understanding.
