Hi, what do you want to do?
Science Museum of Minnesota
Thinking Fountain: Life Cycle of a Fruit Fly
With a 2-liter bottle and some fruit, you can construct a fruit fly trap, which will allow you to observe the life cycle of a fruit fly.
Hunkins Experiments
Hunkin's Experiments
This amazing website provides access to 200 exciting experiments from cartoonist, broadcaster, and engineer, Tim Hunkin. Each experiment is categorized and illustrated.
US Department of Education
Helping Your Child Learn Math: Math at the Grocery Store
Make grocery shopping a mathematical experience. Parents and children explore a variety of math concepts through this collection of engaging math activities. Lesson are presented in varying levels of difficulty, offer "Parent Pointers"...
US Department of Education
Helping Your Child Learn Math: Math in the Home
An excellent compilation of activities that engage parents and children in math explorations at home. Detailed lessons covering a wide range of math topics such as fractions, measurements, money, data collection, and math in newspapers....
Science Buddies
Science Buddies: An Experiment in Visual Perception
Graphical methods of data presentation are a key feature of scientific communication. This project will get you thinking about how to find the best way to communicate scientific information.
Science Buddies
Science Buddies: Interpreting Area Data From Maps vs. Graphs
Graphical methods of data presentation are a key feature of scientific communication. This project asks the question, "What's the best way to compare the land area of states: a map or a bar graph?" You'll be measuring performance on two...
Vision Learning
Visionlearning: Data: Data Analysis and Interpretation
An explanation of data from collection to analysis. Includes a discussion of how the same data may be interpreted various ways by different individuals.
Vision Learning
Visionlearning: Data: Uncertainty, Error, and Confidence
An explanation of how errors may affect data that has been collected for experimentation. Some examples are given.
Vision Learning
Visionlearning: Data: Using Graphs and Visual Data in Science
An explanation of how data can be turned into visual forms which can help people comprehend information easier than observing numbers.
Google
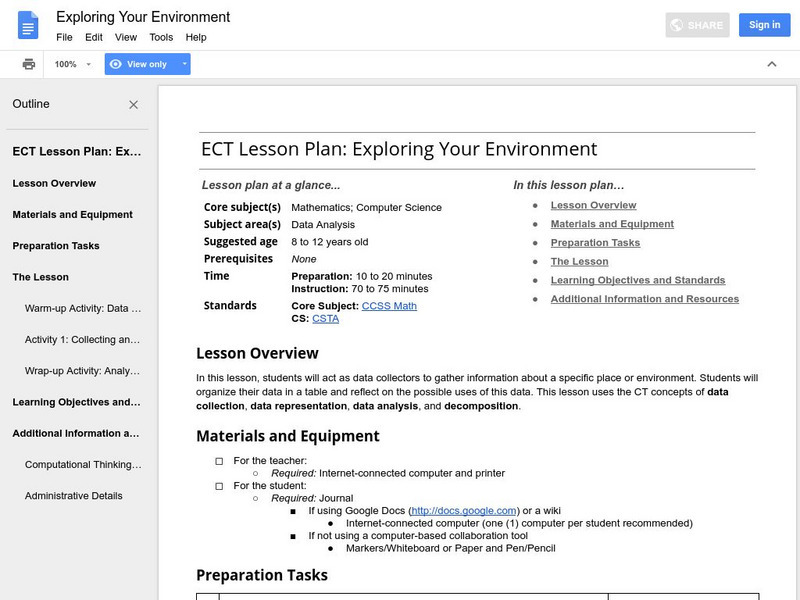
Google for Education: Exploring Your Environment
Students act as data collectors who gather different types of information about various things in the environment. Students then organize the data in a table and reflect on the possible uses of this data.
TeachEngineering
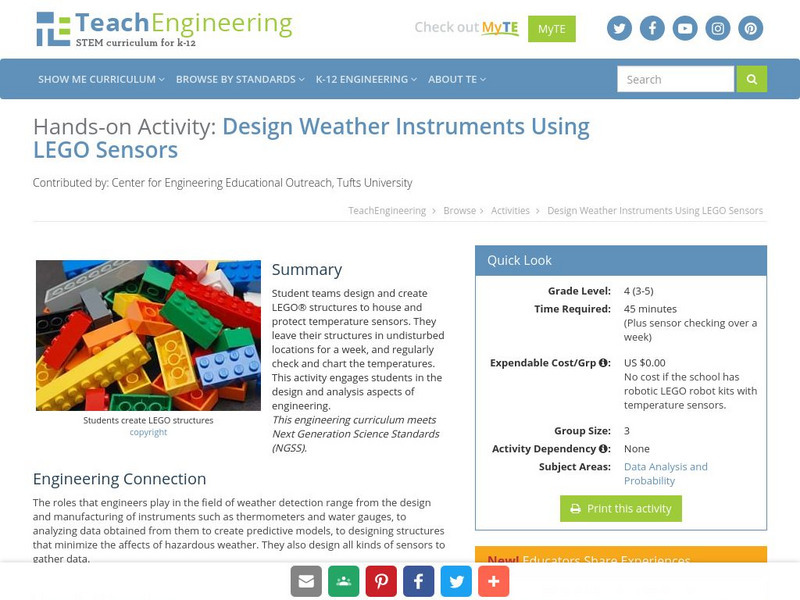
Teach Engineering: Design Weather Instruments Using Lego Sensors
Students will design and create a LEGO structure that will house and protect a temperature sensor. They will leave the structure in a safe spot and check the temperature regularly and chart it.
Annenberg Foundation
Annenberg Learner: Journey North: A Global Study of Wildlife Migration and Seasonal Change
Join teachers and students all over the country in observing the migratory patterns of birds and butterflies and the growth changes of plants as the climate changes. "Journey North" offers a wealth of resources to use as you investigate...
NOAA
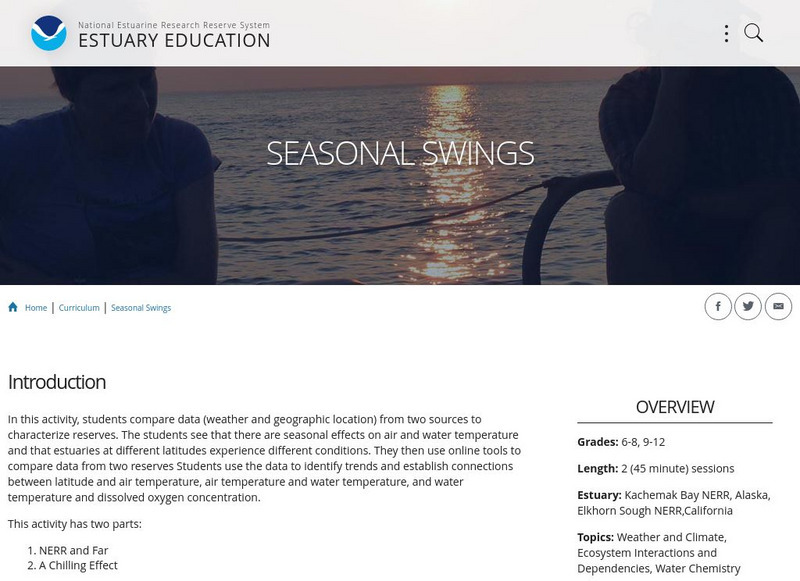
Noaa: Estuaries 101 Curriculum: Seasonal Swings
Students use an interactive map to compare environmental conditions in different estuaries around the National Estuarine Research Reserve System. A second activity allows students to use the Graphing Tool to find, select, and graph data...
US Census Bureau
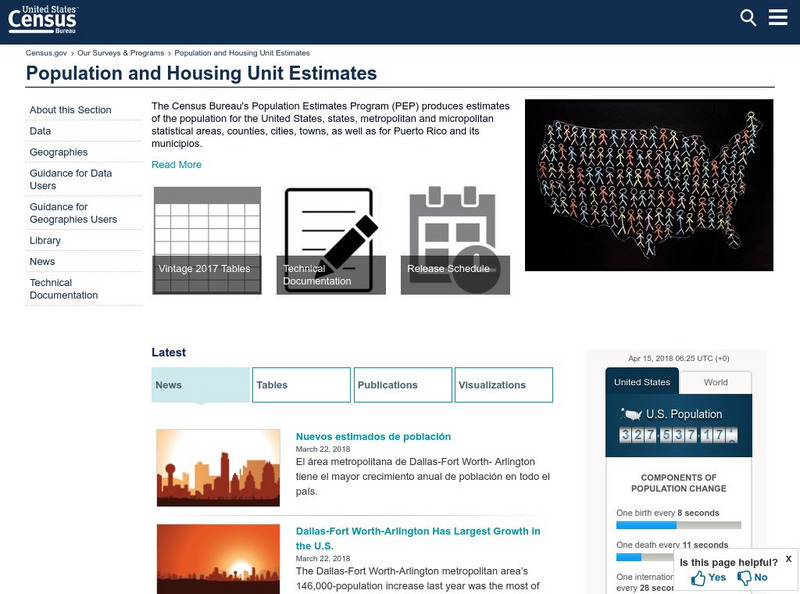
U.s. Census: Population
This site is great for gathering sociological data. Data can be related to a wide variety of topics. Great for research!
Utah Education Network
Uen: Tallies Tell It All
This math instructional activity engages students into mathematical activities. Students will learn about tallying and data collection.
Annenberg Foundation
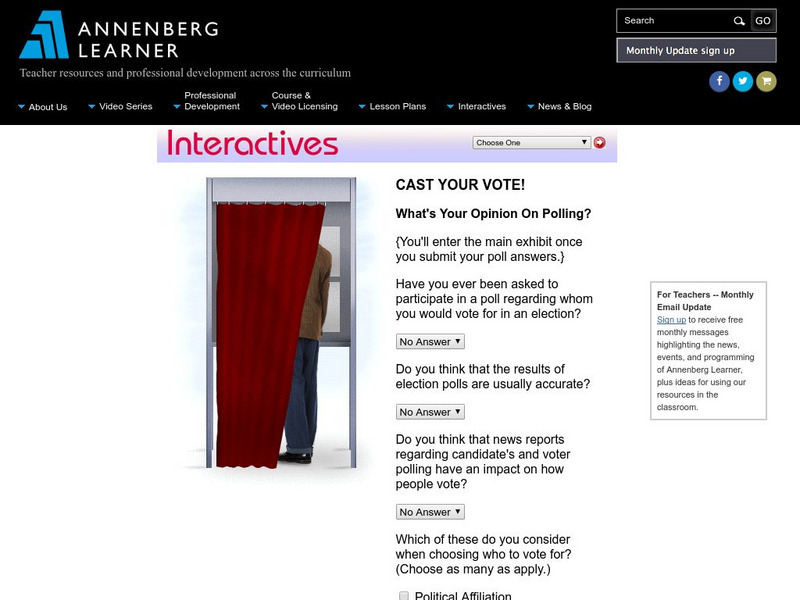
Annenberg Learner: Interactives: Cast Your Vote!
Upper elementary, middle, and high school students can use this exhibit to get an understanding of how polls and elections are conducted. The discussion includes random samples, margins of error, and other concepts related to statistics.
National Council of Teachers of Mathematics
The Math Forum: Exploring Ocean Data Lesson Plan
Find "oceans of data" for students of all ages. NCTM, California, and Philadelphia standards are listed for each grade level along with lesson plans and other website resources.
Center for Innovation in Engineering and Science Education, Stevens Institute of Technology
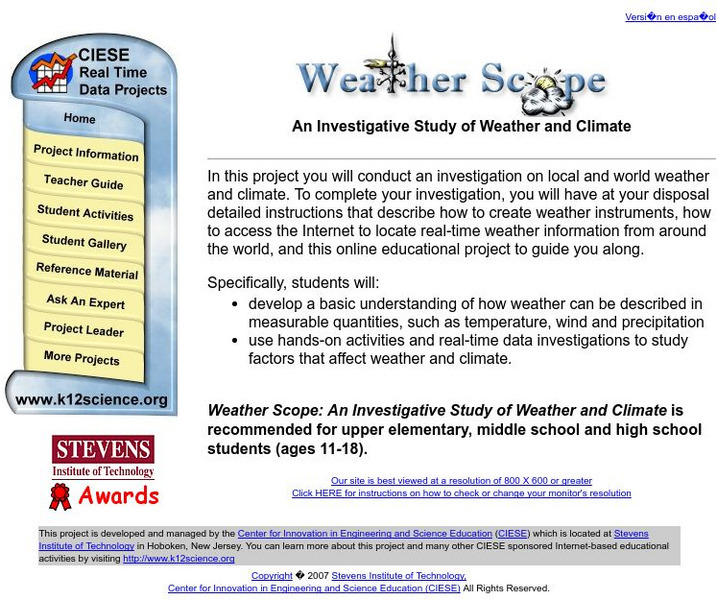
Ciese Real Time Data Projects: Weather Scope: A Study of Weather and Climate
Use real-time data to study factors that affect weather and climate, create weather instruments, and share data with students around the world.
TeachEngineering
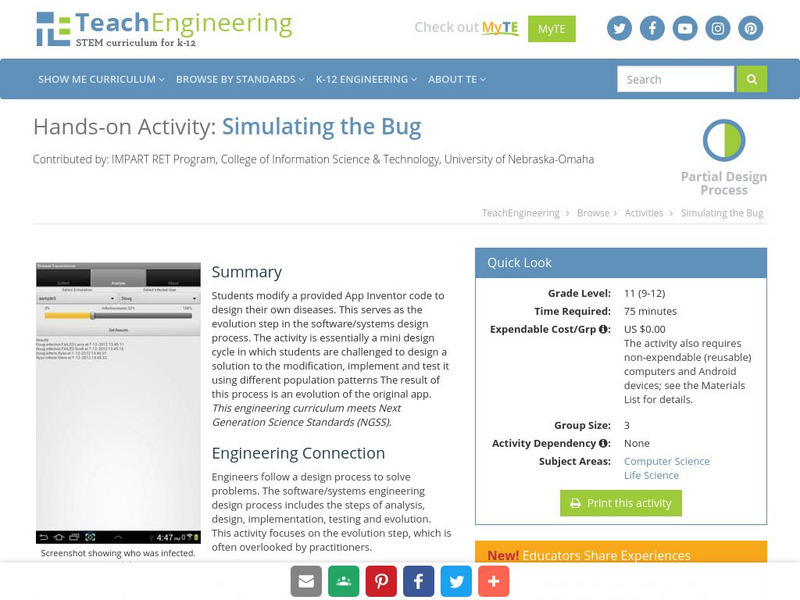
Teach Engineering: Simulating the Bug
Students modify a provided App Inventor code to design their own diseases. This serves as the evolution step in the software/systems design process. The activity is essentially a mini design cycle in which students are challenged to...
TeachEngineering
Teach Engineering: Digital Mapping and Geographic Information Systems (Gis)
Geographic information systems (GIS), once used predominantly by experts in cartography and computer programming, have become pervasive in everyday business and consumer use. This unit explores GIS in general as a technology about which...
University of Arizona
Environmental Tobacco Smoke and Lung Development Activity
An interactive activity designed for you understand the scientific method and how to analyze your data. A step-by-step and personalized experiment geared toward the topic of toxicology.
Texas Education Agency
Texas Gateway: Scientific Investigation and Reasoning Data Organization
Using interactive exercises, students will review how to construct tables and graphs in order to organize data.
Center for Innovation in Engineering and Science Education, Stevens Institute of Technology
Ciese: Human Genetics Project: Is the Dominant Trait Most Prevalent?
Human-Genetics: A Worldwide Search for the Dominant Trait allows you to collect data and share your results with students around the world. Register your class, complete the student survey, participate in discussion boards, and interact...
Center for Innovation in Engineering and Science Education, Stevens Institute of Technology
Ciese: Down the Drain Project
Teachers can start this project at any time and no registration is required. Students collect data about water usage for themselves, their homes and their class. They analyze it, make predictions about it, and submit the data to the...


