Hi, what do you want to do?
Center for Innovation in Engineering and Science Education, Stevens Institute of Technology
Ciese: Collaborative Projects
Using a variety of science topics, these projects link your class with classes around the world in data collection and analysis. There are projects recommended for all grade levels. Begin dates and end dates are listed to help in...
Education Development Center
Math Partners: Statistics and Probability [Pdf]
Comprehensive unit that consists of lessons and activities designed to help students learn statistics and probability concepts.
Center for Innovation in Engineering and Science Education, Stevens Institute of Technology
Ciese Collaborative Projects: Down the Drain: How Much Water Do You Use?
How much water do you use everyday? Find out in this engaging investigation, where you compare your water usage with your classmates and other people around the world. An exploration filled with lots of math and science that students are...
Utah Education Network
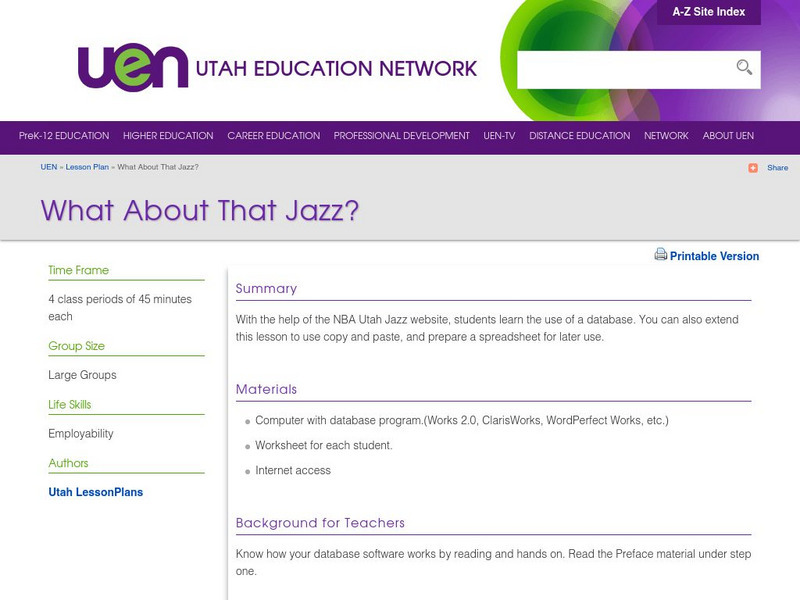
Uen: What About That Jazz?
This lesson plan provides a lesson plan that highlights NBA's Utah Jazz team. Teachers will demonstrate how to use a database, and then students will engage in exploring the database of the Utah Jazz.
CK-12 Foundation
Ck 12: Episd: Physics: 1.8 Working With Error
[Free Registration/Login may be required to access all resource tools.] This learning opportunity examines two angles of working with error. Students will practice taking measurements with accuracy and precision and then consider the...
Center for Innovation in Engineering and Science Education, Stevens Institute of Technology
Ciese Real Time Data Projects: The Stowaway Adventure
Through this series of Internet-based learning experiences and activities, students will use real-time data to track a real ship at sea and monitor weather conditions. Includes a teacher's guide with problem-solving lesson plans...
Center for Innovation in Engineering and Science Education, Stevens Institute of Technology
Ciese Collaborative Projects: International Boiling Point Project
An Internet project designed to determine the greatest influence on the boiling point. After reading the project instructions and performing the experiment, submit your data and compare your results to other classes from around the world.
Stanford University
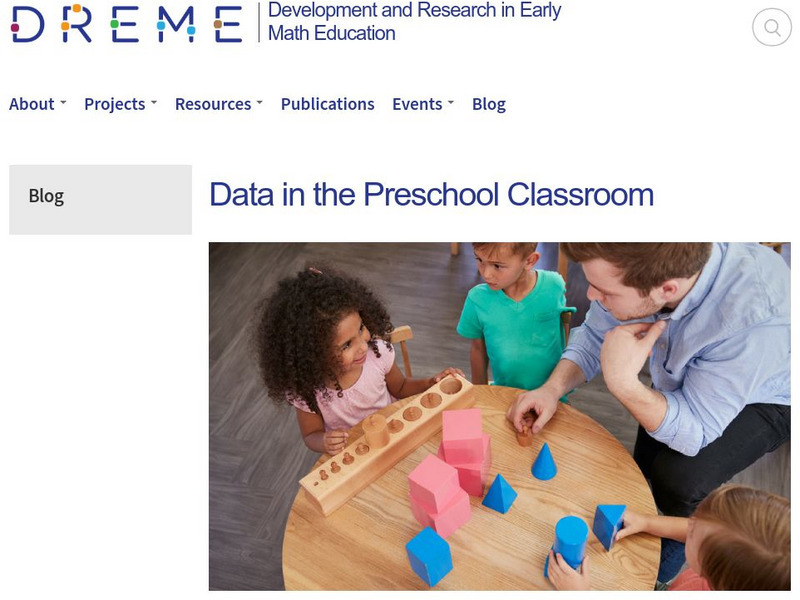
Dreme: Data in the Preschool Classroom
What are the important concepts involved in data collection and data use in the preschool classroom, and how can teachers support the mathematics of data? This article gives a brief description of the concepts that children need to grasp...
Thinkport Education
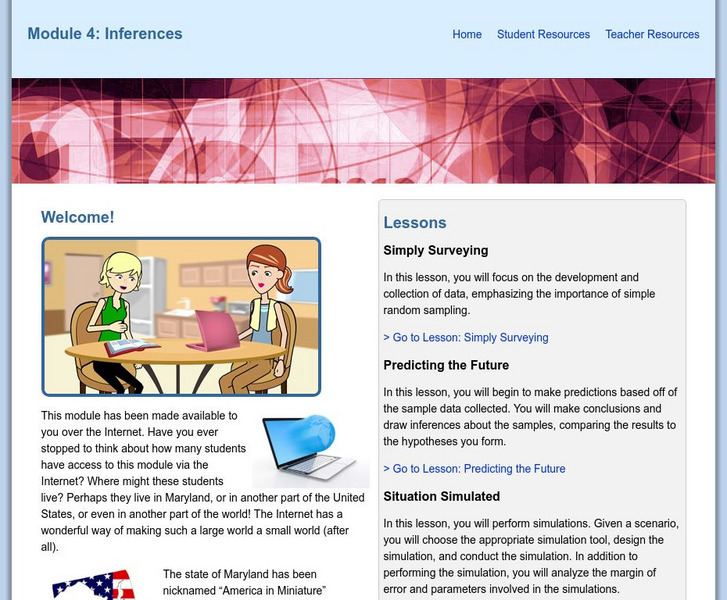
Thinkport: Algebra Ii: Inferences
Focus on the development and collection of data, emphasizing the importance of simple random sampling.
Smithsonian Institution
Smithsonian Learning Lab: Prehistoric Climate Change and Why It Matters Today
In a lesson in this issue of Smithsonian in Your Classroom, students do the work of a team of paleontologists studying a time of rising carbon dioxide and rapid global warming during the Eocene epoch. By examining fossils of tree leaves,...
Other
The Actuarial Foundation: Play Ball! [Pdf]
Young scholars will understand and apply concepts of data collection, representation, and analysis in a sports context.
BSCS Science Learning
Bscs: Global Night Sky Comparison
This inquiry invites students to investigate human impacts on the environment. Specifically, students will examine the relationship between human population, light pollution, and how brightly celestial objects like stars appear in the...
PBS
Pbs Learning Media: Back to School: Activity Starters: Hero Elementary
Be deliberate when inviting your student to watch a PBS KIDS show. These resources can help by adding meaningful conversation and easy activities to their experience watching Hero Elementary.
Cyberbee
Adventures of Cyberbee: Graphing
Teacher-directed lesson plan focusing on data analysis, graphing, and probability. Lesson includes a video and engaging spreadsheet activities.
University of South Florida
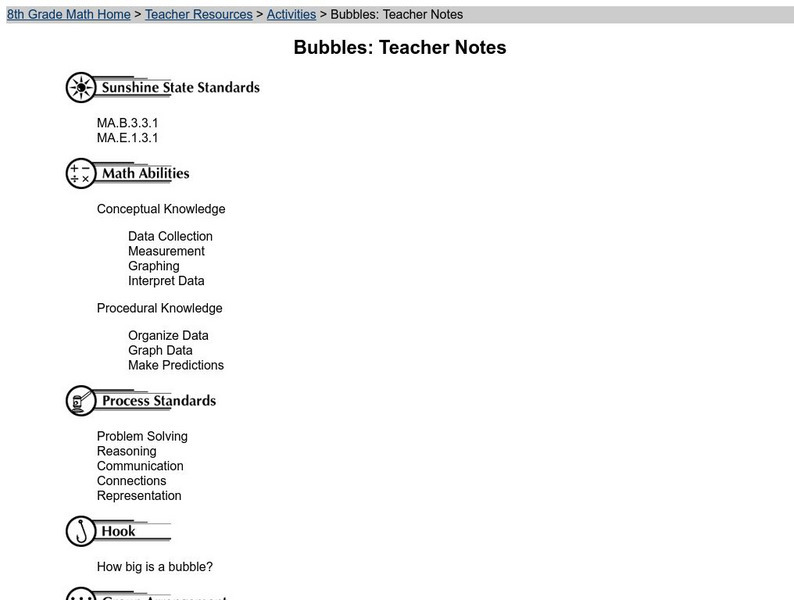
Fcat: Bubbles: Teacher Notes
Students collect data to determine what happens to the sizes of bubbles when glycerin is added to dish detergent. They will practice their measuring skills and have fun at the same time.
University of South Florida
Florida Center for Instructional Tech: Famous People
Students estimate the ages of famous people, then create a scatterplot with the actual ages. This activity allows them to estimate with linear equations. You can access the age data through the "activity" link.
University of South Florida
Florida Center for Instructional Tech: Wacky Water World
At this site investigate linear equations with a graphing calculator. Data is gathered from a hypothetical situation of purchasing tickets at a waterpark.
National Council of Teachers of Mathematics
The Math Forum: Seventh Grade Mathematics: Data Sense
This site has some interesting ways to collect and evaluate data. There are some activities about note taking, spreadsheets, surveys, and a cool bridge construction project. Teachers may want to use this site as a resource for some...
University Corporation for Atmospheric Research
Ucar: Project Sky Math
Teachers will be interested to explore the SkyMath module, and the 16 classroom activities at this site. In this program, students will collect and record real-time weather data to analyze. Data analysis, graphing, number relationship,...
National Council of Teachers of Mathematics
The Math Forum: A Collection of Secondary Math Units
Teachers of grades 9-12 can explore these seven math units for their classes. Data collection and analysis, problem solving with spreadsheets, and linear transformation are just a few of the topics covered here.
Texas Instruments
Texas Instruments: Easy Data App
This App brings a new level of simplicity to calculator-based data collection, making data collection simple and fast.
Texas Instruments
Texas Instruments: Step by Step Activity Data Collection & Analysis
In this activity, students create a situation that produces linear behavior by stepping heel to toe and taking distance readings as each step is taken. Students then apply the properties of a linear function to develop a model for motion.
Texas Instruments
Texas Instruments: Learning Measurement Conversions Through Statistics
Students learn the conversion relationship between inches and centimeters through data collection. The data collected results from measuring items using inches and centimeters as the units. They use a TI-73 to input the data into lists...
Science Education Resource Center at Carleton College
Serc: Mystery Box Scientific Method Inquiry Lab
In this activity, students will use their senses to form hypotheses from observations. They will develop methods of collecting data, other than visual, by trying to determine the contents of several small boxes and should be able to...


![Math Partners: Statistics and Probability [Pdf] Unit Plan Math Partners: Statistics and Probability [Pdf] Unit Plan](https://static.lp.lexp.cloud/images/attachment_defaults/resource/large/FPO-knovation.png)

