Scholastic
Scholastic: Study Jams! Science: Scientific Inquiry: Investigations to Collect Data
Sing along to a karaoke song about collecting data through observation and measurement, review related vocabulary definitions, and take a quiz to test your knowledge.
PBS
Pbs: Mathline Creature Feature Lesson Plan [Pdf]
An interdisciplinary math, science, and language arts lesson that engages students in an exploration of statistics. Through a study of various forest climates, students utilize data collection and analysis, classification, and graphing....
PBS
Pbs Lesson Plan: Chances Are Talking Probability (Pdf) [Pdf]
An introductory lesson in probability for students in grades three to five. The concepts presented in this lesson are interwoven, over time, into a current unit of study. Students examine closely the "language" of probability as used in...
PBS
Pbs Mathline: Button, Button Lesson Plan [Pdf]
An integrated math and language arts lesson focusing on statistics. Students explore the concepts of estimation, data collection, data analysis, classification, graphing, and counting through the reading of the Button Box by Margarette...
PBS
Pbs Mathline: Bubble Mania [Pdf]
Bubble Mania is a lesson plan that focuses on the concept of measurement as it applies to the diameter, circumference, and area in a bubble. Extension activities and connections, related worksheets, and additional resources are included.
PBS
Pbs Mathline Lesson Plan: Struts'n Stuff [Pdf]
Incorporating concepts in algebra, number sense, patterning, data collection, and geometry, this activity engages students in various hands-on activities to explore the relationship between regular polygons and the number of diagonals...
PBS
Pbs Mathline: Sand Babies (Pdf) [Pdf]
In this engaging instructional activity, students use a variety of measurement strategies in creating their own Sand Babies. Students explore standard and non-standard measurements, area, data collection and analysis, and graphing....
PBS
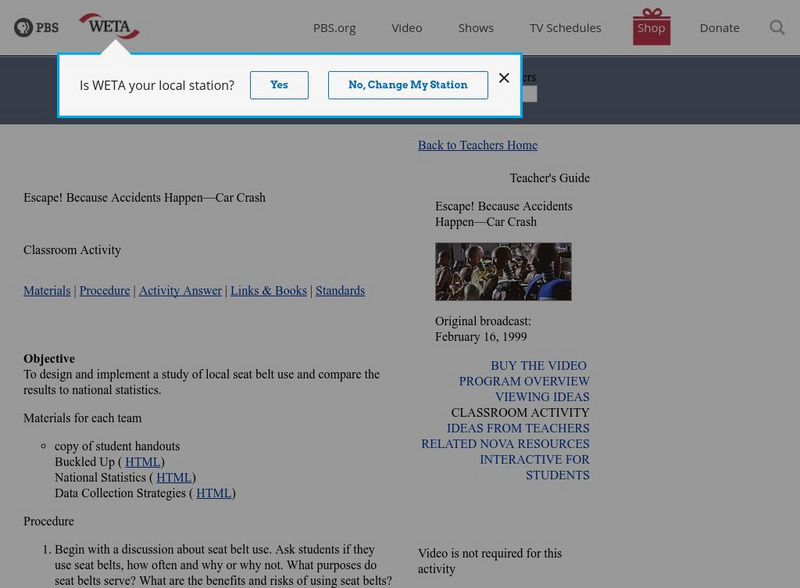
Pbs Teachers: Escape! Because Accidents Happen: Car Crash
Examine the benefits and risks of using seat belts and analyze national statistics on seat belt use. Design and implement a study of local seat belt use and compare the results to the national statistics.
Other
Global Grocery List Project: Homepage
At this site from the Global Grocery List Project, students collect data on the prices of common grocery items and submit their findings. They can then compare the data they collected to data from students around the world. There are...
Other
Rutgers Marine & Coastal Sciences: Cool Classroom
Students and teachers can explore the work of marine scientists and observe the ocean from their computers. Learn about Rutgers Coastal Ocean Observation Laboratory, discover why oceanography is important, and see what life is like in...
Other
Pbs Mathline: It Takes Ten (Pdf) [Pdf]
A metric measurement lesson plan using grams, milliliters, and centimeters. This lesson offers a variety of "hands on" measurement activities using both the customary and metric systems. Additionally, this lesson plan offers extensions,...
PBS
Pbs News Hour: Unemployment
This PBS lesson plan incorporates math, language arts, and economics to study the current unemployment situation in our country. Students begin by watching a story from NewsHour with Jim Lehrer, then create a publication to showcase...
University of Washington
Washington U: Model for Conducting Scientific Research
This page outlines the scientific method, step by step.
Writing Fix
Writing Fix: Are You a Friend for Me?
In this lesson, the book Scaredy Squirrel Makes a Friend, written by Melanie Watt, is used. Students will develop a question, collect data about the question, and then write a sentence about the findings of the data. [Requires Adobe...
Other
The Grain Chain: Stepping Out: Pedometer Experiment [Pdf]
Use your skills of estimation, observation, and data collection to calculate the amount of energy used during your normal walking throughout the day. Use of a pedometer is suggested, but walking steps could be counted by students while...
Microsoft
Microsoft Education Lesson Plan: Making Money From Lemons
Simulation where learners apply mathematics and economics concepts in the lemonade business. Learners set up a virtual lemonade stand and must determine production costs, product variables, and profits. Students record data collected on...
CPALMS
Florida State University Cpalms: Florida Students: Do You Need Me to Repeat That?
Learn how repeated trials during experimentation leads to more reliable results.
Texas Education Agency
Texas Gateway: Data Analysis
Given laboratory investigation data in the form of tables, charts, and graphs, students will analyze and predict trends from the data.
Texas Education Agency
Texas Gateway: Data Organization
Given field and laboratory scenarios and laboratory data, students will construct data tables and graphs, using repeated trials and means to organize data.
Other
Royal Geographical Society: Discovering Antarctica
Resource-rich website will help students understand the challenges that Antarctica faces, the history of its exploration and the relationship between Antarctica and the rest of the world. Activities reveal insights about how it feels to...
Annenberg Foundation
Annenberg Learner: Discovering Psychology: Research Methods
In this activity, you will explore how psychologists draw solid conclusions from the complex and often ambiguous phenomena they study -- how you think, feel, and behave.
Other
I Naturalist
Community-sharing site lets all the world's sharp-eyed naturalists, including school-age students, record their observations of the outdoor world.
National Council of Teachers of Mathematics
Nctm: Figure This: Does Drinking Soda Affect Your Health?
Try this "Real world," challenge taken directly from the today's health journals. Use your problem solving, data analysis, and number sense skills to figure out if soda intake among teenage girls is related to incidences of broken bones....
National Council of Teachers of Mathematics
Nctm: Figure This: Misaddressed Mail
Try this probability challenge from the NCTM Math Challenges for Families series. See if you can figure out the probability of putting three checks in the correct envelopes without looking. Also, discover how probability skills are used...

![Pbs: Mathline Creature Feature Lesson Plan [Pdf] Lesson Plan Pbs: Mathline Creature Feature Lesson Plan [Pdf] Lesson Plan](https://static.lp.lexp.cloud/images/attachment_defaults/resource/large/FPO-knovation.png)
