Hi, what do you want to do?
National Council of Teachers of Mathematics
Nctm: Figure This: Misaddressed Mail
Try this probability challenge from the NCTM Math Challenges for Families series. See if you can figure out the probability of putting three checks in the correct envelopes without looking. Also, discover how probability skills are used...
National Council of Teachers of Mathematics
Nctm: Figure This: Census
Try this real world challenge that focuses on data collection, data analysis, and problem solving with information from the U.S. Census Bureau. Discover how these skills are applied in real life situations in this one page activity from...
Other
Center for Education Partnerships: The Marble Roll
In this Science-athon, students try to make their marble roll the farthest across a flat surface, using their knowledge of forces, motion, and energy to guide them through their apparatus design. Teachers must enroll online.
National Center for Ecological Analysis and Synthesis, University of California Santa Barbara
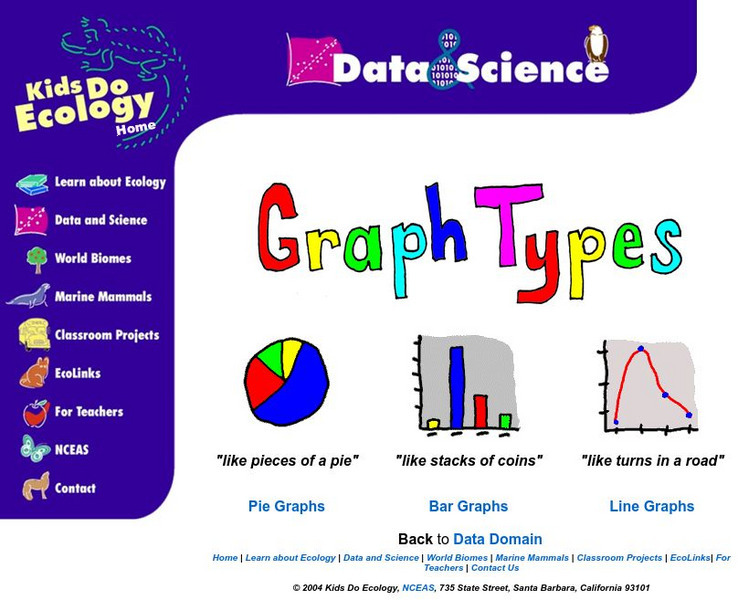
Nceas: Graph Types
At this site from NCEAS you can learn how to organize your data into pie graphs, bar graphs, and line graphs. Explanations and examples are given of each graph along with several questions that check comprehension.
National Center for Ecological Analysis and Synthesis, University of California Santa Barbara
Kids Do Ecology: Data and Science
Learn about conducting your own investigation with these tips on following the scientific method. Find out how to state hypothesis, make observations, collect and analyze data, and display data to share results and conclusions of your...
National Council of Teachers of Mathematics
The Math Forum: Data Collecting in the Classroom
A list of two dozen questions students can easily ask eachother in the classroom to quickly collect data in hopes of using it in their study of making graphs. Some are opinion questions, while others require the counting of certain items...
National Council of Teachers of Mathematics
The Math Forum: Data Collecting Project Stats Class
This lesson plan provides the teacher with all the necessary handouts and directions to give a statistics class when they are ready to complete a thorough survey project. Broken into five parts, it takes the students through the...
National Council of Teachers of Mathematics
The Math Forum: Growth Creature Lab Data Collecting
Lesson plan completely explains how young scholars will collect data on the growth of an "alligator" and determine the relationship of the growth data to the Fundamental Theorem of Similarity and to topics in geometry in general. All of...
University of Waterloo (Canada)
Wired Math: Organizing Data Grade 7 [Pdf]
A collection of worksheets that focus on data analysis and organizing data. Includes detailed examples, colorful visuals, and a link to a related game. Acrobat Reader required.
Goodwill
Gcf Global: Excel 2016
A website with 33 links plus a quiz on how to use Microsoft Excel 2016. Topics include Excel 2016 Basics, Working with Cells and Sheets, Formulas and Functions, Working with Data, Doing More with Excel, and Extras.
Other
Cajon Valley Digital Academy: Google Forms
This digital teaching resource addresses the uses of Google Forms in the classroom. A video demonstration [3:30] and long slideshow provide applications of Google Forms in the Common Core classroom. CCSS.ELA-Literacy.CCRA.W.7.
Other
Visible Geology: Stereonet
A lower hemisphere graph for the placement of geological data is called a stereonet. This site allows students to plot data on their own stereonet(s).
Utah Education Network
Uen: 2nd Grade Act. 05: Olympics
Stuents will participate in the shared reading of Jump, Kangaroo, Jump by Stuart Murphy. After the reading, 2nd graders will fill out an Olympic events recording sheet.
University of Georgia
University of Georgia: Inter Math: Types of Data
This site has a concise definition of "Data," plus examples of data types and collection methods.
CK-12 Foundation
Ck 12: Statistics: Surveys and Sample
[Free Registration/Login may be required to access all resource tools.] Learn how to use surveying and sampling to collect accurate data.
Rice University
Rice University: Cynthia Lanius: Let's Graph
An introduction to bar graphs, both vertical and horizontal in nature. The interactive aspect of this site allows students to change the values of the data - their favorite cafeteria foods - and then see how the graph is changed.
TED Talks
Ted: Ted Ed: David Mc Candless: The Beauty of Data Visualization
Listen and watch as David McCandless turns complex data sets into beautiful, simple diagrams. He suggests that information design is really important because we all like to visualize our information. [18:19]
American Museum of Natural History
American Museum of Natural History: Field Journal O Logy Card
OLogy cards are like virtual baseball cards about all kinds of science topics. This one is about collecting data in a field journal. There's a great example of how a field journal was used to discover an extinct species! See if you can...
PBS
Pbs Cyberchase: Bugs in the System
Play with data- make a graph by catching bugs! Help the cyber squad clean up the mess.
Alabama Learning Exchange
Alex: Is My Water Safe?
After a discussion of what makes water safe or unsafe, students will visit a local tributary, test the water, and complete tasks concerning the water. This lesson is designed for a 6th, 7th, and 8th grade gifted education enrichment...
Alabama Learning Exchange
Alex: Pacaderms, Pennies, and Pasta
After learning of a historical event in which elephants were used to test out the Brooklyn Bridge, students construct their own bridge using very basic materials. Students weigh different items to determine the weight their bridge can...
Alabama Learning Exchange
Alex: Pass It Down
This lesson, Pass It Down, integrates science and math into two consecutive hands-on genetics activities that should be embedded within an existing genetics unit suitable for biology students. The results of each activity will be...
Alabama Learning Exchange
Alex: Lip Balm Science
During this instructional activity, students will make three types of lip balm. They will then predict which lip balm they think will be preferred by testers and test that prediction by collecting data from testers who sample the lip...
Alabama Learning Exchange
Alex: Something's Fishy: A Lesson in Biological Sampling
Determining the population in a larger area by tagging. By using proper scientific method and careful sampling procedures, students learn how biologists work in the field to collect data about a population. Students will also calculate...


