Hi, what do you want to do?
Alabama Learning Exchange
Alex: Where Did You Get Those "Jeans"?
This instructional activity can be interdisciplinary involving science, mathematics, and language arts. The primary nature of the instructional activity is inquiry, project, and technology-based. In science this project is a culminating...
Alabama Learning Exchange
Alex: Mystery Powder Investigation
During this lesson, young scholars will work individually to identify a mystery powder. Students will have the opportunity to test known powders with different substances and record observations. Young scholars will develop a plan that...
Alabama Learning Exchange
Alex: On the Loose With Dr. Seuss
Students will survey teachers in order to find out the titles of their favorite Dr. Seuss books. They will work in small groups and use digital cameras to take pictures of each teacher and his/her favorite book.
NPR: National Public Radio
Npr: Firms Are Buying, Sharing Your Online Info. What Can You Do About It?
Learn how companies are buying and sahring personal inforamtion.
Goodwill
Gcf Global: Internet Safety: Understanding Browser Tracking
Learn all about browser tracking and cookies in this tutorial.
Concord Consortium
Concord Consortium: California American Community Survey (Acs) Data Portal
Working with large datasets that support exploration of patterns is an essential first step in becoming fluent with data. In this dynamic data science activity, students can access part of the U.S. Census Bureau's American Community...
Concord Consortium
Concord Consortium: National Health and Nutrition Examination Survey Data Portal
Access and explore large datasets from the National Health and Nutrition Examination Survey (NHANES, 2003). Working with large datasets that emphasize exploration, finding patterns, and modeling is an essential first step in becoming...
Better Lesson
Better Lesson: What Is Your Favorite Pet?
SWBAT create a bar graph to match a data set. SWBAT analyze the graph to find 3 pieces of information the graph shows them.
Better Lesson
Better Lesson: What Is Your Favorite Little Bear Story?
SWBAT create a bar graph to match a data set. SWBAT analyze the graph for 3 pieces of information.
Better Lesson
Better Lesson: What Playground Toy Should the Principal Buy for Us
SWBAT use a graph as evidence in a persuasive letter. SWBAT evaluate statements to determine which statement is true, citing evidence in the graph.
Better Lesson
Better Lesson: What Is Your Favorite Snack?
SWBAT use graphs to analyze whether a statement is true or false. SWBAT use graphs as evidence for a persuasive letter.
Shodor Education Foundation
Shodor Interactivate: Misleading Graphs
This lesson will challenge students to think creatively by having them design and build water balloon catchers from random scrap materials, while requiring them to take into consideration a multitude of variables including cost,...
Other
Nearpod: Construct & Interpret Scatter Plots
In this lesson plan on scatter plots, 8th graders will learn how to interpret scatter plots and then graph them using a data table.
Other
Nearpod: Scatterplots, Correlation & Lines of Best Fit
In this lesson on scatterplots, students will learn how to create the line of best fit and analyze scatterplots by learning about correlations and causation.
E-learning for Kids
E Learning for Kids: Math: Olive Trees: Data & Chance
Ariel is taking a survey. Do you want to help her collect and describe data?
National Council of Teachers of Mathematics
Nctm: Comparing Properties of the Mean and Median
Through the use of technology, students can investigate how the mean and median of a set of date compares when values the data changes.
Scholastic
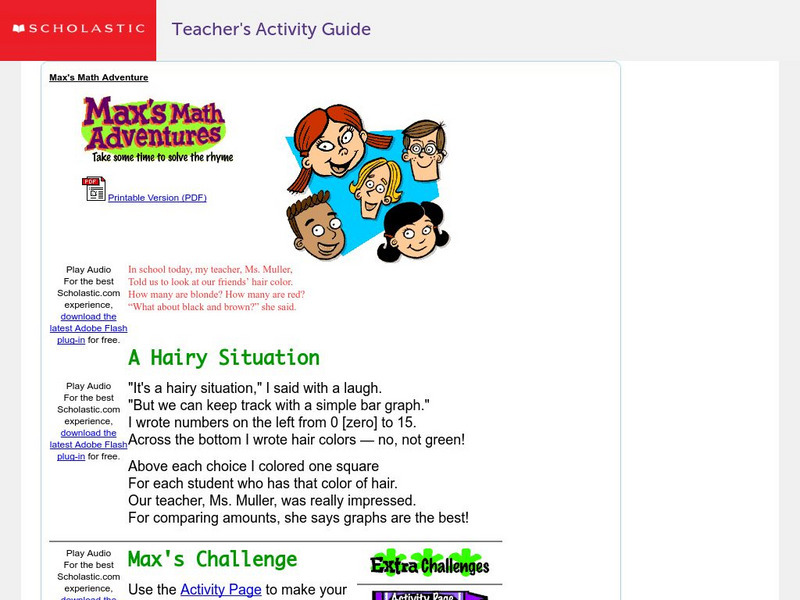
Scholastic: Max's Math Adventures: A Hairy Situation
Help Max make a bar graph to show the hair colors of his classmates. Teachers will appreciate the activities with bar graphs in the extra challenges. Use the teacher's guide to create a fun and engaging lesson.
Math Slice
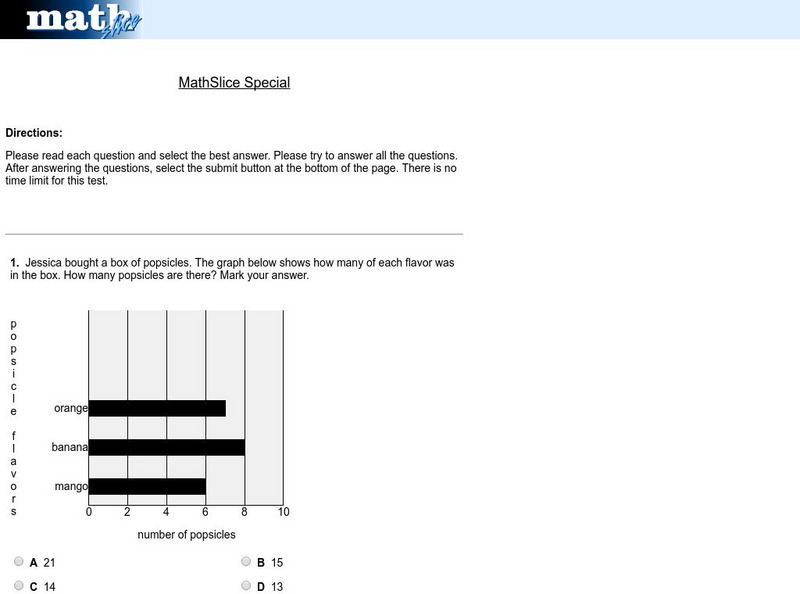
Math Slice: Chart Slice Special Test
A ten question test assessing data collection and analysis skills with bar graphs. Assessment is scored online. An excellent tool for assessment.
PBS
Pbs Mathline Lesson Plan: Money Counts [Pdf]
This PBS lesson plan features an assortment of interactive learning activities on number sense and computation that conform to NCTM standards. You get a list of materials, activity worksheets, related resources, and extension activities....
PBS
Pbs Mathline: Whirlybirds [Pdf]
This engaging lesson combines the concepts of statistics and measurement. Students create a simulation of a parachute jump using whirlybirds, to predict the frequency of an event occurring. A detailed lesson plan which includes a list of...
Other
Sun Associates: 3 Steps for Technology Evaluation [Pdf]
This pdf document outlines the three steps and outcomes of a technology evalution project. Although this process is designed to be facilitated by an outside agency, districts could use this information to design their own evaluation...
Houghton Mifflin Harcourt
Houghton Mifflin Harcourt: Saxon Activity Center: Graphing Calculator Activity: Average [Pdf]
A concise graphing calculator lesson on calculating average. Detailed examples, demonstrations of calculator functions, and practice problems included. Acrobat Reader required.
Houghton Mifflin Harcourt
Houghton Mifflin Harcourt: Saxon Activity Center: Real World Investigation: Elevation Changes [Pdf]
Math and geography are the focus of this internet investigation. Learners must plan a road trip to several cities and plot the elevations of those cities using a line graph. Acrobat Reader required.
Sophia Learning
Sophia: Handling Laboratory Samples: Lesson 3
This lesson will explain the techniques and glassware used to "deliver" samples versus measure and "contain" samples. It is 3 of 3 in the series titled "Handling Laboratory Samples."


