Texas Instruments
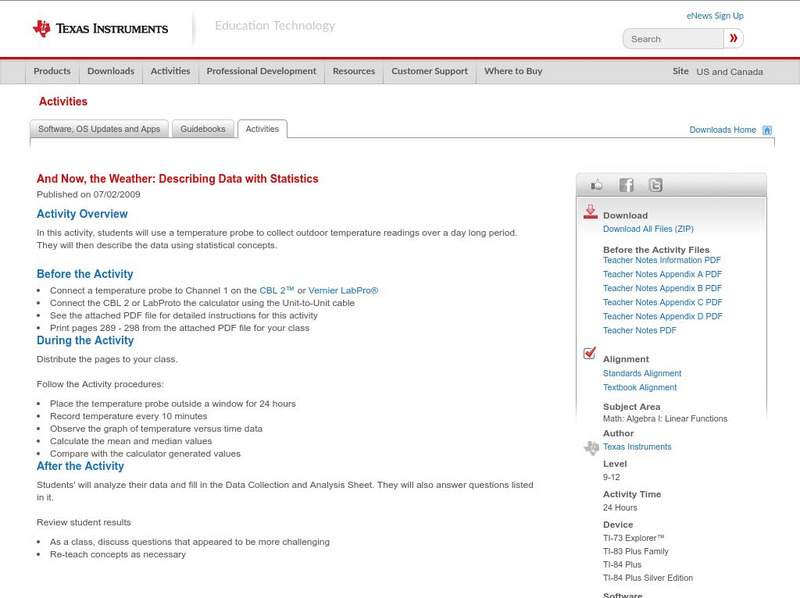
Texas Instruments: And Now, the Weather: Describing Data With Statistics
In this activity, students can use a temperature probe to collect outdoor temperature readings over a day long period. They will then describe the data Using statistical concepts.
Texas Instruments
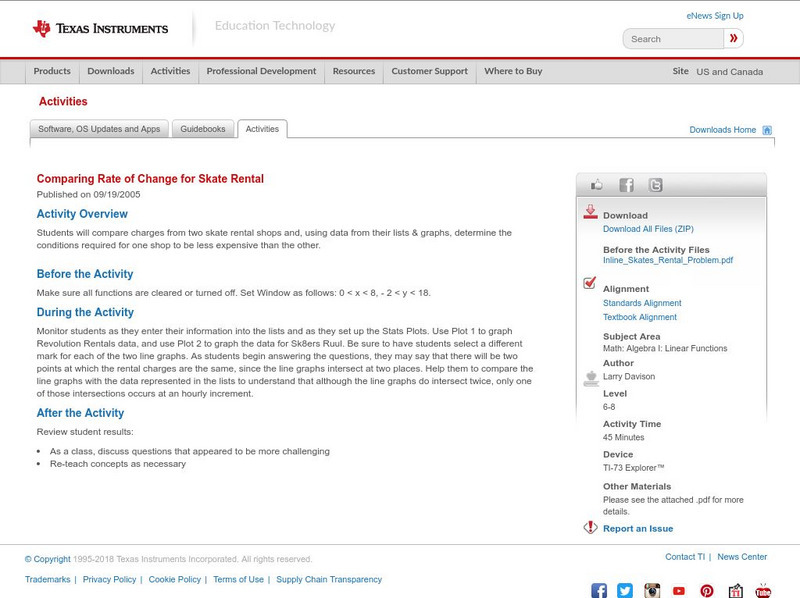
Texas Instruments: Comparing Rate of Change for Skate Rental
Students will compare charges from two skate rental shops and, using data from their lists & graphs, determine the conditions required for one shop to be less expensive than the other.
Other
Stat Soft: Statistics Glossary
Dozens of statistical terms are defined and illustrated in this glossary.
CK-12 Foundation
Ck 12: Statistics: Displaying by Type of Data Grade 8
[Free Registration/Login may be required to access all resource tools.] Create and use different data displays to analyze and draw conclusions about different sets of data.
ABCya
Ab Cya: Panic in Pet Paradise
It's pandemonium at Pet Paradise Hotel! The picky pets are quite particular about where they are staying. Can you figure out the puzzle correctly so that each dog, cat, mouse and bird is happy?
Texas Instruments
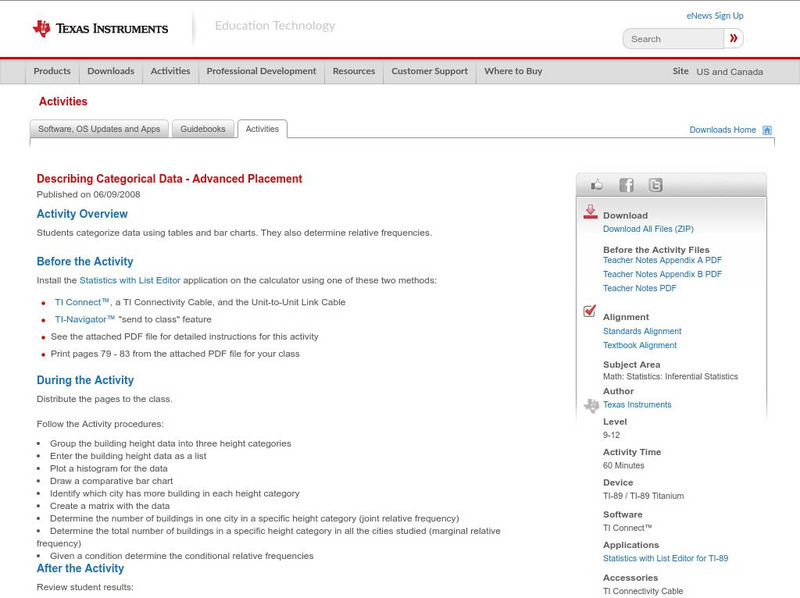
Texas Instruments: Describing Categorical Data Advanced Placement
Young scholars categorize data using tables and bar charts. They also determine relative frequencies.
Texas Instruments
Texas Instruments: Describing Categorical Data
Students analyze the distribution of categorical data. They calculate percents and visually compare the data sets with a bar chart.
Khan Academy
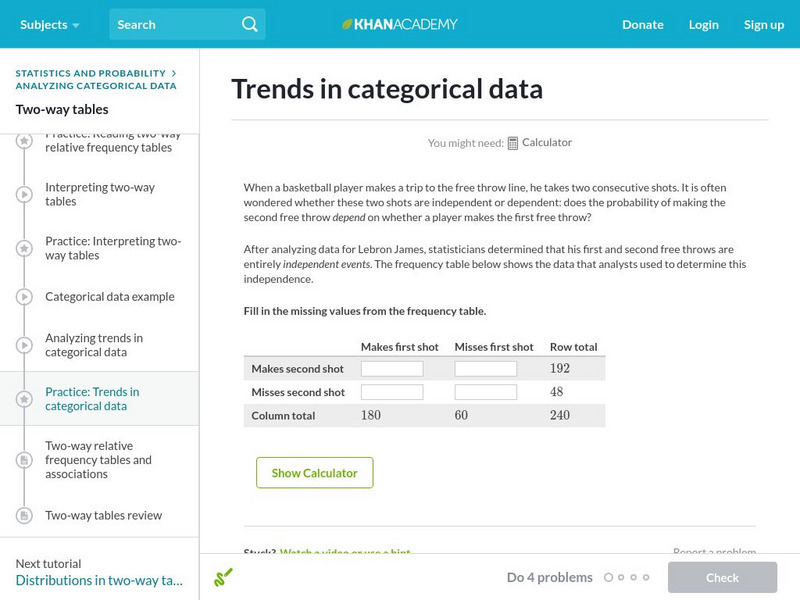
Khan Academy: Trends in Categorical Data
Analyze categorical data to find some trends. Students receive immediate feedback and have the opportunity to try questions repeatedly, watch a video or receive hints.
Illustrative Mathematics
Illustrative Mathematics: N q.a.3 and S id.a: Accuracy of Carbon 14 Dating I
This task examines, from a mathematical and statistical point of view, how scientists measure the age of organic materials by measuring the ratio of Carbon 14 to Carbon 12. The focus here is on the statistical nature of such dating....
University of Georgia
University of Georgia: Inter Math: Types of Data
This site has a concise definition of "Data," plus examples of data types and collection methods.
CK-12 Foundation
Ck 12: Statistics: Basic Graph Types
[Free Registration/Login may be required to access all resource tools.] Organize distributions of data by using a number of different methods.
CK-12 Foundation
Ck 12: Statistics: Displaying Categorical Variables
[Free Registration/Login may be required to access all resource tools.] This Concept covers a few ways in which categorical data can be displayed; using bar graphs and pie graphs.
CK-12 Foundation
Ck 12: Basic Graph Types
[Free Registration/Login may be required to access all resource tools.] Students will review the different types of graphs, and the differences between discrete and continuous data, and between qualitative and quantitative data. They...
Other
Minitab: Comparison of Categorical and Quantitative Variables
This resource explains the difference between categorical and quantitative variables and provides examples of each.
