Curated OER
Linear Relationships - Standard Form
Students use a graphing calculator to examine the association between the data points and equation of a linear relationship. They write equations in standard form and then graph the equations using the slop-intercept form. Answer Key...
Curated OER
Systems of Linear Equations
Students use the calculator to represent a situation as a table, graph, and equation. They write systems of equations and find solutions to systems of equations. In addition, they explain and justify how they determined their
solutions...
Curated OER
Quadratic Function Investigations
Learners perform investigation of quadratic functions while taking part in the solving of various types of problems. They explore the changes in the coefficients on the quadratic function to observe the patterns. The lesson includes...
Curated OER
Asymptotes And Zeros of Rational Functions
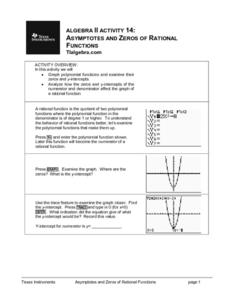
Budding mathematicians graph polynomial functions and examine their zero and y-intercepts. They analyze how the zero and y-intercepts of the numerator and denominator affect the graph of a rational function. Several great additional...
Curated OER
Linear Equations
Students discover the equation of a line. They accurately record data collected from the game, "You're On A Roll", create number sentences by rolling dice, and choose their own values for the multiplication and addition steps.
Curated OER
The Great Race
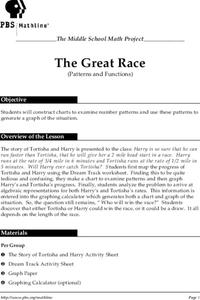
Students are presented with a story about two individuals running a race in which one is given a head start. Students must map the progress of the runners, create a chart examining patterns and graph the progress. In the end, students...
Curated OER
Equations in Motion: Design and construct a mobile
Students participate in a lesson plan that covers the concepts of solving equations and inequalities. To master the concept they must demonstrate visually and verbally how both sides of an equation must be balanced. They construct a...
Curated OER
Solving Equations (Combined and Applications)
Seventh graders, after completing a warm up on if you have three more diamonds than two times what Jon has, and you have 17 diamonds, how many diamonds does Jon have?, generalize a method for solving algebraic equations to model a given...
Curated OER
Biomagnification
Students use real data to create an algebraic equation. They explain how the build up of small levels of contaminates can quickly become detrimental to species higher in the food chain.
Curated OER
Solving Using Linear Equations
Seventh graders explore linear equations. They observe the relationship between linear equations an patterns. Students make decisions using information given in graphs to solve linear equations. They perform a toothpick activity to...
Curated OER
Functions and the Vertical Line Test
Students examine functions and function notation. They use computer activities to discover how to graph functions, and conduct a vertical line test. Students describe spatial relationships using coordinate geometry.
Curated OER
Exploring Linear Equations And Scatter Plots - Chapter 5 Review
Students complete rolling stocks experiment, and collect and enter data on the computer. They enter data on graphing calculators, complete scatter plot by hand with line of best fit, and discuss different graphing methods.
Curated OER
First Degree Equations
Students establish a solid competence in solving all types of equations and a solid understanding of how variables and equations can be utilitzed to solve real life problems.
Curated OER
Graphing Linear Equations
Ninth graders develop an understanding of and the applications for linear equations and their graphical displays. They participate in a cooperative learning activity of matching a graphic display with an equation.
Curated OER
Slopes of Lines
Students examine a graph and relate it to the real world situation it depicts. They investigate changes in an equation and the appearance of a line. They investigate the connection between the graph of a situation and the meaning of the...
Curated OER
Baseball Relationships - Using Scatter Plots
Students use graphing calculators to create scatter plots of given baseball data. They also determine percentages and ratios, slope, y-intercepts, etc. all using baseball data and statistics.
Curated OER
Graphing Linear Equations
Ninth graders examine the applications for linear equations and their graphical displays. They observe a demonstration, solve problems independently, and play a computer game.
Curated OER
Learning how to balance equations
High schoolers play Chembalancer game and balance equations using the trial and error method.
Curated OER
Pac Man Chomps Again
Students are given the opportunity to pracitce math while participating in a tag game. They get to (i.e. identify greater and lesser numbers) and solve small problems concerning mathematical comparisons .
Curated OER
Dancing Number Sentences
Learners explore how dance can be infused with mathematics. In this art and mathematics lesson, students recognize how the ABA dance form is similar to a math number sentence. Learners create a dance choosing dance words to represent...
Curated OER
Lessen the Loan
Middle-schoolers explore the concept linear equations. They use the internet to navigate through videos and problems. Pupils problem solve to determine rates of change, slope, and x and y-intercepts.
Curated OER
Using Data Analysis to Review Linear Functions
Using either data provided or data that has been collected, young mathematicians graph linear functions to best fit their scatterplot. They also analyze their data and make predicitons based on the data. This lesson is intended as a...
Curated OER
Graphing Linear Functions Two
Use this graphing linear functions worksheet to have learners graph three linear equations. They use a table of values, the intercept method, and slope-intercept form to graph three functions.
Curated OER
Graphing Linear Functions
In this linear functions activity, students graph 3 linear functions. Students graph each function by making a table of values given a linear function in standard form.
