Pennsylvania Department of Education
Freckle Face
Students collect and record data. In this early data analysis lesson, students gather data about their partners face. As a class, the students use tally marks and pictographs to record the data and answer question about the information...
Curated OER
Mathematics Lesson Plan
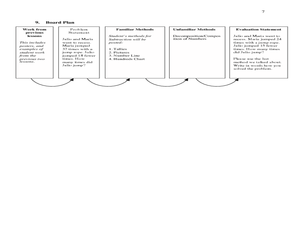
Second graders study subtraction facts. In this mathematics lesson, 2nd graders discuss how to solve two digit subtraction problems. Students recognize that there are many different methods or strategies one can use such as using...
Curated OER
Holiday Tally
In this tally chart worksheet, students ask ten friends which of 3 holidays they like best. Students create a tally chart with their results and answer 6 questions.
Curated OER
Classy Fractions
In this fractions worksheet, students find the total numbers of students in their class and ask each student 7 questions provided. Students make a tally chart to record the responses and calculate the fraction of the class that answered...
Curated OER
Tally Chart/Pictograph
In this graphic organizer worksheet, students can record their own data on this tally chart/pictograph. There are two columns and six rows with room for a title.
Curated OER
Tossing a Number Cube-- Tally Marks
In this math worksheet, students investigate probability by tossing a number cube 20 times and recording the times that it lands on each number. Tally marks are used to record data. Students then participate in an experiment in...
Curated OER
Tally Marks
In this mathematical worksheet, students practice mastering the concept of keeping up with tally marks in a variety of activities. Students complete a survey involving tally marks.
Curated OER
Graphing With Candy
Young scholars gather information and interpret the results using a tally chart, a table, and a bar graph.
Curated OER
Pictograms
Have your class practice using a pictogram with this resource. Learners count tally marks, and answer a few questions related to the graph. Afterwards, they could create their own pictograms.
Curated OER
Tally Time
Students create a tally chart. In this math and health lesson, students discuss healthy foods and create a tally chart showing the number of students who like to eat healthy foods.
Curated OER
Groundhog Day
Learners use the SMART Board to learn about Groundhog day and create a tally chart of predictions for whether he will see his shadow or not. In this Groundhog day lesson plan, students respond to questions throughout the lesson plan.
Curated OER
Graphing With Paper and Computers
Fourth graders construct bar graphs. For this graphing lesson, 4th graders create bar graphs in connection with the story, The Copycat Fish. After creating the initial graphs on paper, students use MS Excel to create graphs.
Curated OER
Count the Tally Marks
In this counting skills learning exercise, students examine 6 set of tally marks, count each of the sets, and record the number in each of the sets.
Curated OER
Count and Tally
In this counting skills activity, students respond to 4 questions that require them to count items pictured and use tally marks to total them.
Curated OER
Count and Tally 2
In this counting skills worksheet, students respond to 6 questions that require them to count items pictured and use tally marks to total them.
Curated OER
My Test Book: Tally Charts
In this online interactive math worksheet, students solve 10 problems that require them to read and interpret tally chart data. Students may submit their answers to be scored.
Curated OER
Organizing Data
For this tally chart worksheet, students complete a tally chart of the number of each animal they see in the picture and answer short answer questions about it. Students complete the chart for 5 animals and answer 3 questions.
Curated OER
Ice Cream Scoop
In this data display worksheet, students write 6 flavors of ice cream on pieces of paper. Students choose papers one at a time and keep track on a tally sheet. Students make a bar graph of the results.
Curated OER
Wordle It
Students discuss, define, and give themselves character traits. In this character traits lesson plan, students create a list of ten character traits that describe themselves. Students create a data table and poll their classmates about...
Curated OER
Graphing Data
First graders learn how to display data using a bar graph. In this bar graph instructional activity, 1st graders use data from a t-shirt color survey to make a bar graph. They also make an animal bar graph before interpreting the...
Curated OER
Data Handling: Tally Chart on Illnesses
In this tally chart worksheet, students analyze a chart showing childhood illness cases. Students use the tally chart to solve 6 problems.
Curated OER
Tally Chart: Favorite Names
In this data display learning exercise, students analyze a tally chart of favorite hamster names. Using the information on the chart, students solve 8 word problems.
Alabama Learning Exchange
What's Your Favorite Chocolate Bar?
Students complete a math survey. In this math graphs lesson, students complete a survey about their favorite candy bars. Students create different kinds of graphs using Microsoft Excel to show their results.
Curated OER
Tally Charts
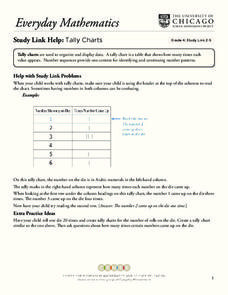
In this tally charts worksheet, students discuss how to use a tally chart and how to read the chart. Once students record information on a tally chart they answer questions showing their ability to read a tally chart.


