Houghton Mifflin Harcourt
Houghton Mifflin Harcourt: Saxon Activity Center: Real World Investigation: Elevation Changes [Pdf]
Math and geography are the focus of this internet investigation. Learners must plan a road trip to several cities and plot the elevations of those cities using a line graph. Acrobat Reader required.
Purple Math
Purplemath: Scatterplots and Regressions
Explains the purpose of scatterplots, and demonstrates how to draw them.
Rice University
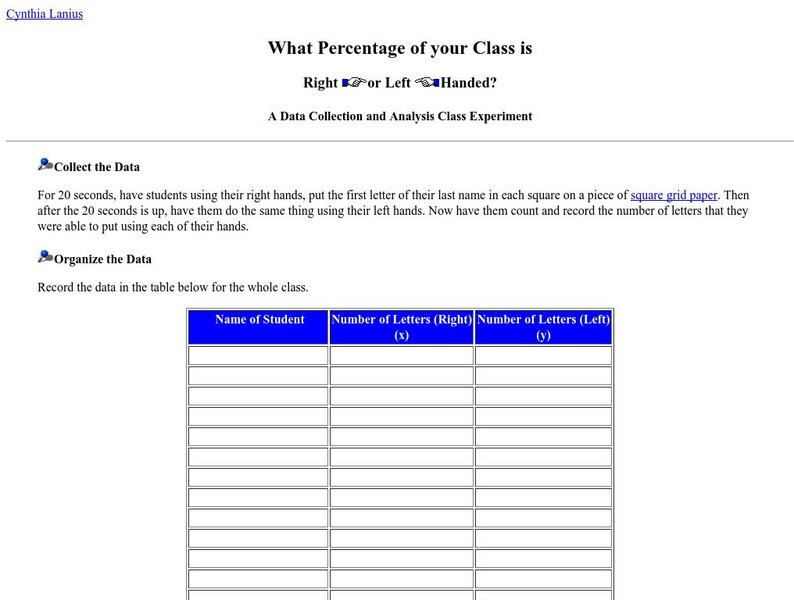
What Percentage of Your Class Is Right or Left Handed?
What percentage of the class is right or left-handed? Students will investigate this question using statistical processes of collecting the data, organizing it, graphing, and finally analyzing it. Follow-up questions are provided for the...
Rice University
Rice University: The Hand Squeeze
Students will enjoy this data collection and class analysis experiment involving the time it takes for a hand squeeze to travel around a circle of people. From organizing the activity to collecting the data to making a table and graphing...
![Houghton Mifflin Harcourt: Saxon Activity Center: Real World Investigation: Elevation Changes [Pdf] Activity Houghton Mifflin Harcourt: Saxon Activity Center: Real World Investigation: Elevation Changes [Pdf] Activity](https://static.lp.lexp.cloud/images/attachment_defaults/resource/large/FPO-knovation.png)


