Global Health with Greg Martin
Data Analysis Fundamentals: Describing, Summarizing, and Visualizing Data
This video provides a comprehensive guide on how to describe, summarize, and visualize data, covering key concepts such as variables, distributions, and statistical measures. It explains different types of data, such as categorical and...
Curated Video
Identifying Outliers in Data Sets Using Quartiles
In this video, the teacher explains how to identify outliers in data sets using quartiles. They use the example of temperature data in Chicago to demonstrate the process. The teacher emphasizes the importance of not simply dismissing...
Curated Video
Comparing Box Plots: Analyzing Shape, Center, and Spread
This video explains how to interpret and compare box plots by analyzing shape, center, and spread. We review the five-number summary and how to determine the minimum, quartiles, median, and maximum. We also discuss the importance of...
Curated Video
Comparing Center and Spread of Texting Habits: Analyzing Box Plots
In this video, the teacher explains how to compare box plots by analyzing the center and spread of data sets. Using the example of high school students' daily text usage, the teacher demonstrates how to find the median and interquartile...
Flipped Math
Boxplots and Interquartile Range
Box in a lesson on box plots. Viewers of an informative video learn how to create box plots, both by hand and by using a graphing calculator. Additionally, they determine the interquartile range and interpret the value in terms of the...
Anywhere Math
Box-and-Whisker Plots
Whiskers are more than just a cat facial feature! Learn how the whiskers of a box-and-whisker help make conclusions about a data set. An instructor first explains how to create a box-and-whisker and then how to read it. Several examples...
Corbett Maths
Comparing Box Plots
Stacked box plots create an informative visual display. Using a video lesson, scholars compare data from box plots plotted on the same number line. They use both the visual display and the key intervals to make conclusions.
Corbett Maths
Drawing and Reading Box Plots
Box and whiskers have more to do with data than they do with cats! A video lesson describes how to plot, analyze, and compare box plots. Mathematicians first learn to create a box plot and then how to use information about the quartiles...
Anywhere Math
Measures of Variation
Variation makes the world—and data sets—more interesting. Young data analysts view an engaging YouTube video to learn about measures of variation. Range and interquartile range are the topics under consideration here.
Crash Course
Measures of Spread: Crash Course Statistics #4
Sometimes the measures of center don't give us enough information. The spread of the data can tell statisticians much more about the data set. A video lesson, part of a statistics video series, describes different measures of spread such...
Mathed Up!
Stem and Leaf Diagrams
Order the data within a stem-and-leaf display. Pupils take data and create and ordered stem-and-leaf diagrams, including the key. Participants take their data and determine answers about the information. Class members then find...
Virtual Nerd
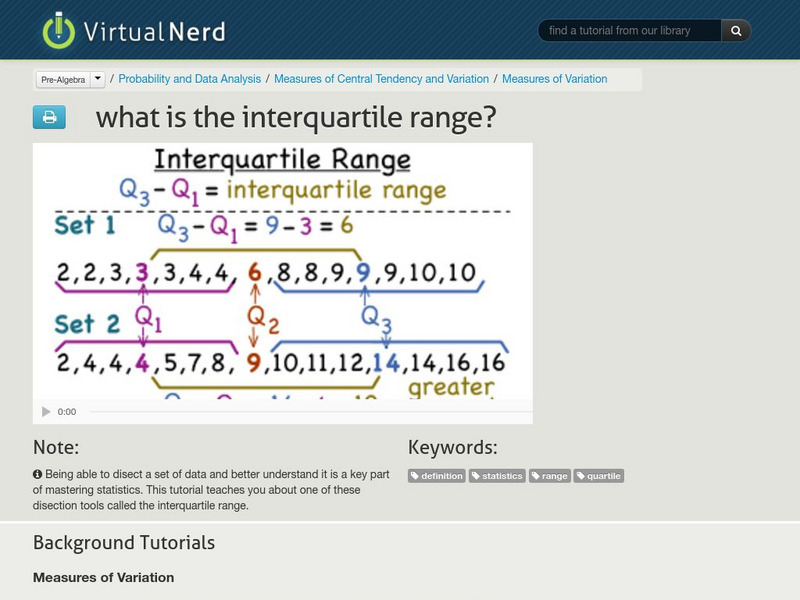
Virtual Nerd: What Is the Interquartile Range?
The interquartile range is the middle 50% of a data set. Watch this tutorial to learn how to dissect data and understand this concept. [4:33]
Texas Education Agency
Texas Gateway: Study Edge Statistics: Measuring Spread of a Distribution
This lesson looks at the different measures of center and variability that are used when analyzing the spread of data in a distribution. Includes downloadable study guide with exercises - guide also covers other topics. [17:21]
Virtual Nerd
Virtual Nerd: What Is the Interquartile Range?
This tutorial teaches about one of the ways to dissect a set of data called the interquartile range. [4:34]
Khan Academy
Khan Academy: Interquartile Range (Iqr)
Learn how to calculate the interquartile range, the video describes a step by step process to calculate this range.
Sophia Learning
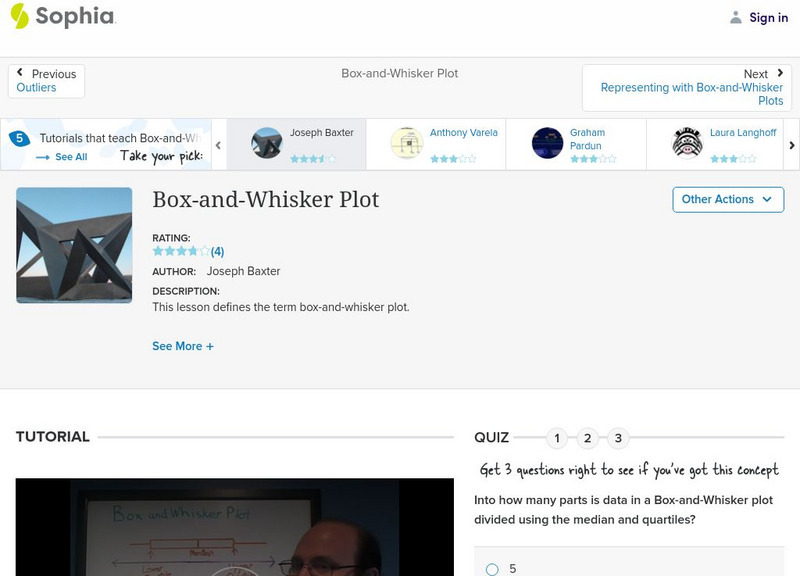
Sophia: Box and Whisker Plot
Box-and-whisker plots are explored in this video tutorial. The lesson reviews how to set up the graph and labels the parts of a box-and-whisker plot.
Sophia Learning
Sophia: Box and Whisker Plots
Box-and-whisker plots are explored in this tutorial. The lesson provides a PowerPoint presentation that defines the terms involved and a video lesson that demonstrates how to create a box-and-whisker plot.
Math Mammoth
Math Mammoth: Measures of Statistical Variation: A Beginner Lesson
A lesson in how to calculate measures of variation, including the range, the interquartile range, and the mean absolute deviation, and what each of these terms mean. [9:59]
Math Mammoth
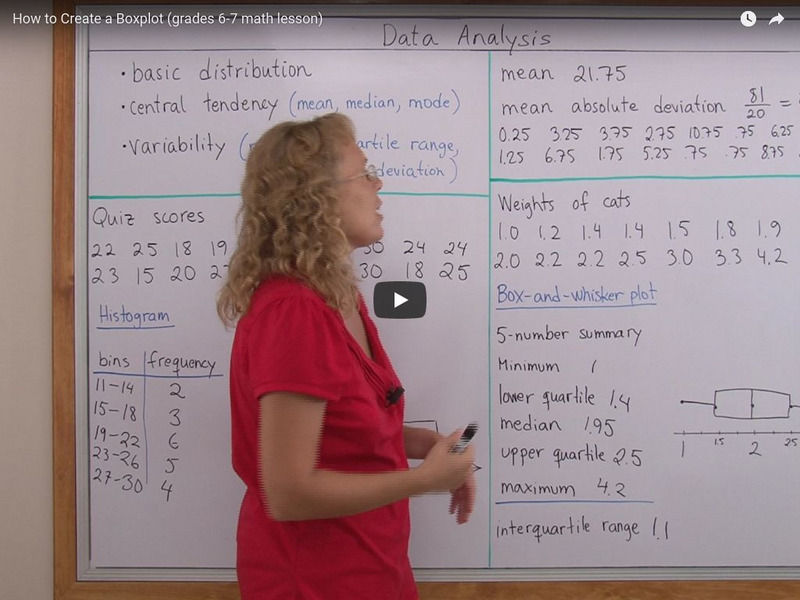
Math Mammoth: How to Create a Boxplot
This lesson explains how to draw a box-and-whisker or box plot, and the terms used to describe one. [4:30]
Crash Course
Crash Course Statistics #4: Measures of Spread
This episode looks at measures of spread, or dispersion, which we use to understand how well medians and means represent the data, and how reliable our conclusions are. They can help understand test scores, income inequality, spot stock...
Loyola University Chicago
Math Flix: Graphs: Box and Whisker Plots
This video provides an opportunity to create a Box and Whisker Plot. A pdf worksheet is available by clicking on the hyperlink at the bottom of the page. As you watch and listen to the teacher and student interact it helps clarify the...
Sophia Learning
Sophia: Some Statistical Terms #2
This lesson will define the terms quartile, lower quartile, upper quartile, and interquartile range.
Sophia Learning
Sophia: Interpreting Box and Whisker Plots
This video lesson demonstrates how to interpret box-and-whisker plots to find outliers.


