Shodor Education Foundation
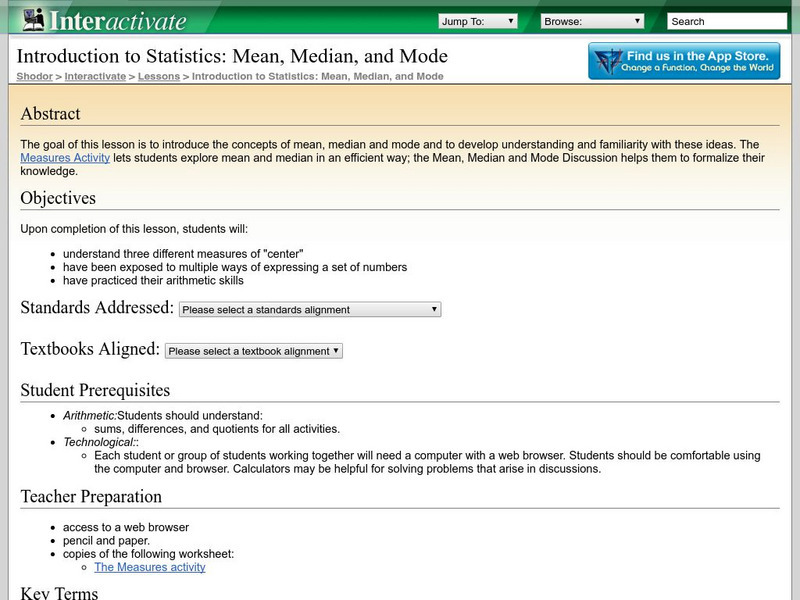
Shodor Interactivate: Lesson: Introduction to Statistics
"The goal of this lesson is to introduce the concepts of mean, median and mode and to develop understanding and familiarity with these ideas." This lesson is provided by Shodor Education Foundation.
Wolfram Research
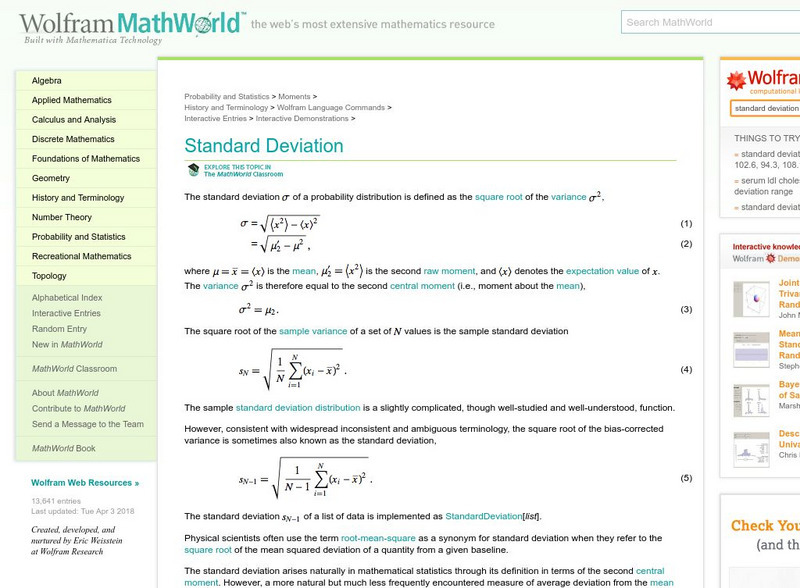
Wolfram Math World: Standard Deviation
This World of Mathematics site by Eric Weisstein explains the term "Standard deviation." Provides step-by-step help, examples, and charts.
PBS
Pbs Learning Media: Restocking Shoes
In this video from Cyberchase, Bianca uses data on past shoe sales to help her decide what quantities of each size she should order in the next shipment.
Rice University
Hyper Stat Online Statistics Textbook
Many people cringe at the idea of studying statistics, but it doesn't have to be impossible! David M. Lane, Associate Professor of Psychology, Statistics, and Management at Rice University, offers a large collection of resources for the...
Other
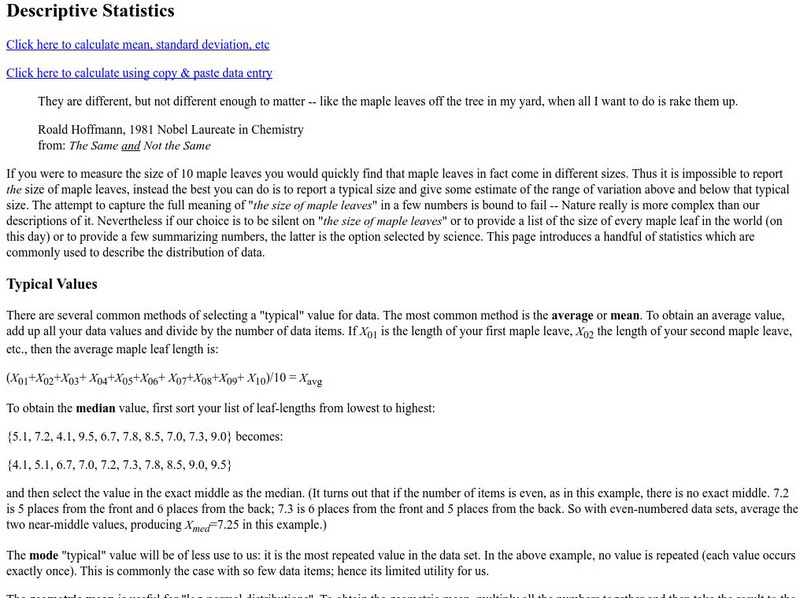
Descriptive Statistics
Very complete explanation of mean, standard deviation, etc. including an online calcluator for these statistics.
Missouri State University
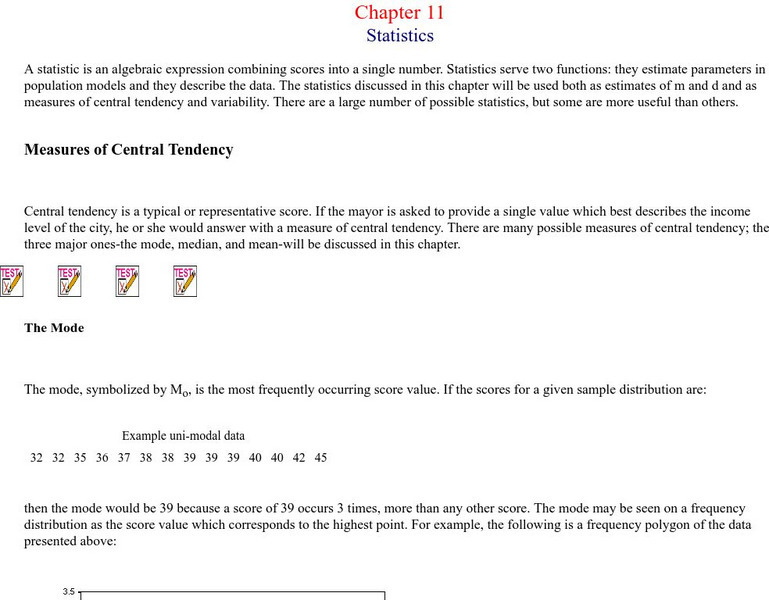
Missouri State University: Introductory Statistics: Statistics
This is an excellent resource on what the science of statistics involves. There are all kinds of definitions, examples, graphs, and charts to learn from. The topics covered include: mode, mean, median, skewed distributions and measures...
McGraw Hill
Glencoe: Self Check Quizzes 2 Mean, Median and Mode
Use Glencoe's Math Course 2 randomly generated self-checking quiz to test your knowledge of finding the mean, median and mode. Each question has a "Hint" link to help. Choose the correct answer for each problem. At the bottom of the page...
McGraw Hill
Glencoe: Self Check Quizzes 1 Mean
Use Glencoe's randomly generated self-checking quiz to test your knowledge of finding the mean for a data set. Each question has a "Hint" link to help. Choose the correct answer for each problem. At the bottom of the page click the...
University of Georgia
University of Georgia: Mean Value Theorem
This site has a detailed explanation of the Mean Value Theorem.
Google
Google for Education: Sorting Data
In this example students use data collected from their class and learn to sort it before calculating the mean, median, and mode. Additionally, students learn how to use spreadsheet functions to sort based on different criteria, leading...
TeachEngineering
Teach Engineering: Means, Modes, and Medians
Students experience data collection, analysis and inquiry in this LEGO MINDSTORMS NXT -based activity. They measure the position of an oscillating platform using a ultrasonic sensor and perform statistical analysis to determine the mean,...
BBC
Bbc: Ks2 Bitesize: Maths: Handling Data
This site provides games, quizes, and information about handling data, including mode, median, and mean.
That Quiz
That Quiz: Practice Test: Graphs
This resource allows users to test their knowledge of graphs and graphing methods.
Education Development Center
Math Partners: Statistics and Probability [Pdf]
Comprehensive unit that consists of lessons and activities designed to help students learn statistics and probability concepts.
University of Texas
Inside Mathematics: Baseball Players [Pdf]
This task challenges students to demonstrate understanding of the concept of measure of center.
Missouri State University
Missouri State University: Introductory Statistics: The Normal Curve
Provides lengthy explanations of the measures of central tendencies - mean, mode, and median - and the measures of variability - range, variance, standard deviation - are given here. Graphs of interesting "side items" are presented as...
Missouri State University
Missouri State U.: Statistics: Measures of Central Tendency and Variability
Provides lengthy explanations of the measures of central tendency - mean, mode, and median - and the measures of variability - range, variance, standard deviation. Graphs of interesting examples are presented as well, skewed...
Khan Academy
Khan Academy: Sampling Distribution of a Sample Proportion Example
Presents a problem that is similar to what might be on an AP Statistics exam. Walks students through each step for solving it and students input answers to questions along the way.
Columbia University
Columbia University: Expected Value Pdf
A PDF explaining and giving examples to show how the expected value of a random variable indicates its weighted average.
Math Drills
Math Drills: Statistics and Probability Worksheets
Download these free worksheets to sharpen your skills with statistics and probability. Sheets focus on collecting and organizing data, measures of central tendency (mean, median, mode, and range), and probability.
Cuemath
Cuemath: Measures of Central Tendency
A comprehensive guide for learning all about measures of central tendency with definitions of mean, median, and mode, solved examples, and practice questions.
BSCS Science Learning
Bscs: Globe at Night Dark Skies
For this inquiry, students predict the best place to stargaze in Arizona based on the brightness of the night sky. Students are introduced to the concept of light pollution and Globe at Night, a global citizen science project in which...
BSCS Science Learning
Bscs: Globe at Night Dark Skies
In this inquiry, students predict the best place to stargaze in Arizona based on the brightness of the night sky. Students are introduced to the concept of light pollution and Globe at Night, a global citizen science project in which...
E-learning for Kids
E Learning for Kids: Math: Elephant Plant: Line Graphs and Mean
Many plants are sold in the garden center. But how many exactly?
