Concord Consortium
Seeing Math: Plop It
Plop It! lets you experiment with the concepts of mean, median, and mode (measures of center). You see the differences among them on a bar graph, as you add or remove blocks to an axis with a given range.
Houghton Mifflin Harcourt
Holt, Rinehart and Winston: Homework Help Independent Practice: Measures of Central Tendency
Get independent practice working with the mean, median and mode. Each incorrect response gets a text box explanation and another try. Correct responses are confirmed.
AAA Math
Aaa Math: Central Tendencies Notes
A complete description of mean, median and mode. Interactive games and practice exercises are included.
University of Illinois
University of Illinois: Data Types
The University of Illinois provides this site that is helpful because of the various kinds of data that can be collected. This lesson plan helps students differentiate between qualitative, quantitative, and many other types of data.
Texas Instruments
Texas Instruments: Numb3 Rs: Harmonizing Means
Based off of the hit television show NUMB3RS, this lesson exposes students to a different type of average, the harmonic mean. Although it is briefly reviewed in the lesson, students are expected to already be familiar with arithmetic and...
Texas Instruments
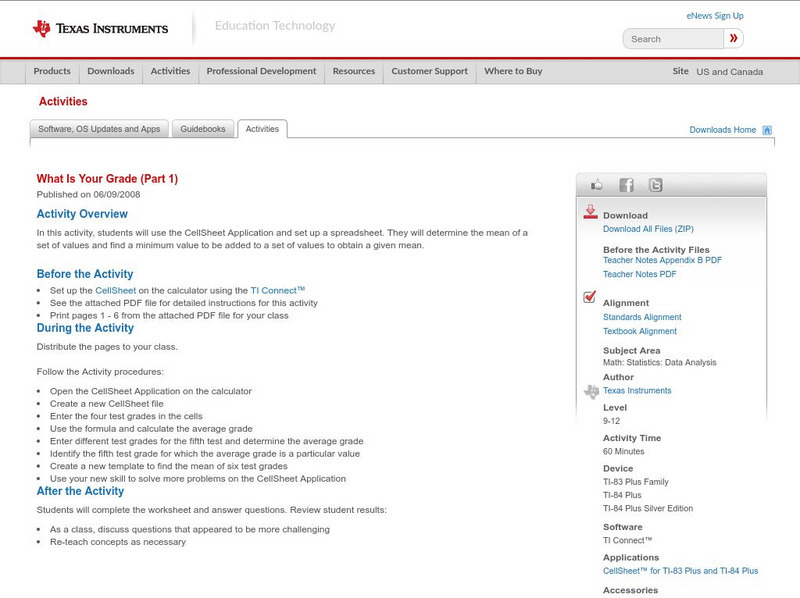
Texas Instruments: What Is Your Grade (Part 1)
In this activity, students can use the CellSheet Application and set up a spreadsheet. They will determine the mean of a set of values and find a minimum value to be added to a set of values to obtain a given mean.
Texas Instruments
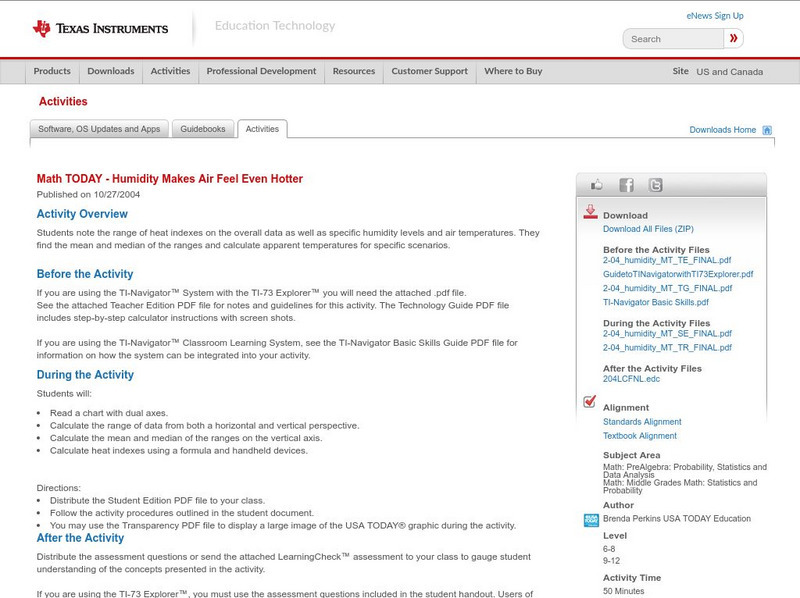
Texas Instruments: Math Today Humidity Makes Air Feel Even Hotter
Students note the range of heat indexes on the overall data as well as specific humidity levels and air temperatures. They find the mean and median of the ranges and calculate apparent temperatures for specific scenarios.
Texas Instruments
Texas Instruments: An Average Lunch?
Students explore the meaning of the average (mean) value for a set of data.
Texas Instruments
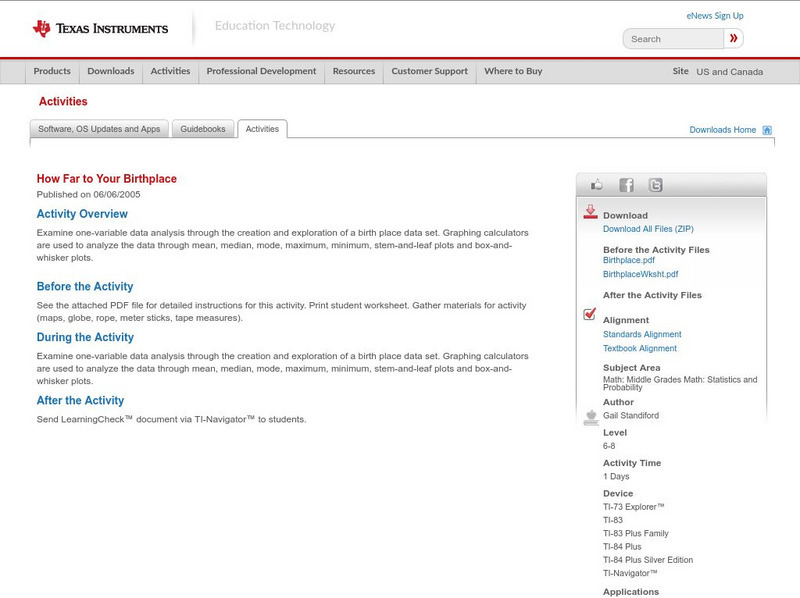
Texas Instruments: How Far to Your Birthplace
Examine one-variable data analysis through the creation and exploration of a birth place data set. Graphing calculators are used to analyze the data through mean, median, mode, maximum, minimum, stem-and-leaf plots and box-and-whisker...
Texas Instruments
Texas Instruments: How Close Is Close?
In this activity, students compute statistical measures like the mean, standard deviation, and variance of the data set. They understand how measures of variability can be interpreted.
Texas Instruments
Texas Instruments: Parts Is Parts
Students find a sample of a given size with a given mean. In this activity, students show one way 100 families can have a mean of 2.58 children and understand the meaning of the term "average".
Texas Instruments
Texas Instruments: Measures of Central Tendency
Mean, median, and mode are measures of central tendency in data analysis. Each can be used to identify central tendency. Box-and-whiskers plots are a visual representation of collected data involving medians.
Texas Instruments
Texas Instruments: Glencoe Pre Algebra: Graphing Calculator: Mean and Median
Students will find the mean and median of a set of data.
Texas Instruments
Texas Instruments: Simulation of Sampling Distributions
This set contains questions about simulating sampling distributions. Students see graphs of simulated distributions enabling them to reach conclusions about mean, shape, and standard deviation.
Texas Instruments
Texas Instruments: Data and Statistical Methods 1
In this set of exercises, a set of data is provided; students answer questions about mean, median, mode, and quartiles. Questions are multiple choice with solutions provided.
Texas Instruments
Texas Instruments: Probability as Relative Frequency
In this activity, students use simulation to justify the concept of the Law of Large Numbers. They understand that as the sample size increases, the relative frequency of which an event occurs approaches the probability of that event...
Texas Instruments
Texas Instruments: What Is Your Grade (Part 2)
In this activity, students use the CellSheet Application to determine the missing value in a weighted mean. They use the application to write a formula to find the weighted mean and also learn to use the copy and paste features.
Science Education Resource Center at Carleton College
Serc: Nitrate Levels in the Rock Creek Park Watershed: Meas of Central Tendency
Activity uses water-quality data from Rock Creek Park to illustrate elementary statistical measures of exploratory data analysis. The focus of the lesson is the nutrient limitation in a stream and the three measures of central tendency.
Stefan Warner and Steven R. Costenoble
Finite Mathematics & Applied Calculus: Measures of Central Tendency
Students learn about measures of central tendency. Topics explored are mean, median, mode, and expected value. The tutorial investigates the statistics concepts through class notes and examples. Review exercises and a chapter quiz are...
Stefan Warner and Steven R. Costenoble
Finite Mathematics & Applied Calculus: Mean, Median & Standard Deviation
Students learn about mean, median, variance, and standard deviation. The tutorial investigates the statistics concepts though class notes and examples. Review exercises are included.
Rice University
Hyper Stat Online Statistics Textbook: Central Tendency
Click on mean, median, mode, trimean, or trimmed mean to review central tendency.
Beacon Learning Center
Beacon Learning Center: All That Data 2
Students describe graphs and explore range, measures of central tendency, and distribution in this interactive web lesson.
Beacon Learning Center
Beacon Learning Center: All That Data
Students analyze data by finding the mean, median, mode, and range of a set of numbers. Line plots, bar graphs, and circle graphs are also included in this lesson.
Oswego City School District
Regents Exam Prep Center: Statistical Studies, Central Tendency, and Dispersion
The mathematics tutorial investigates statistical studies, central tendency, and dispersion. The lesson consists of class notes, calculator tips, examples, and practice problems with solutions. The teacher resource includes an activity...


