Hi, what do you want to do?
University of Illinois
University of Illinois: Data Types
The University of Illinois provides this site that is helpful because of the various kinds of data that can be collected. This lesson plan helps students differentiate between qualitative, quantitative, and many other types of data.
University of Georgia
University of Georgia: Measures of Variation
Lesson plan introduces and explains how to calculate measures of variation concepts such as range and quartile.
Texas Instruments
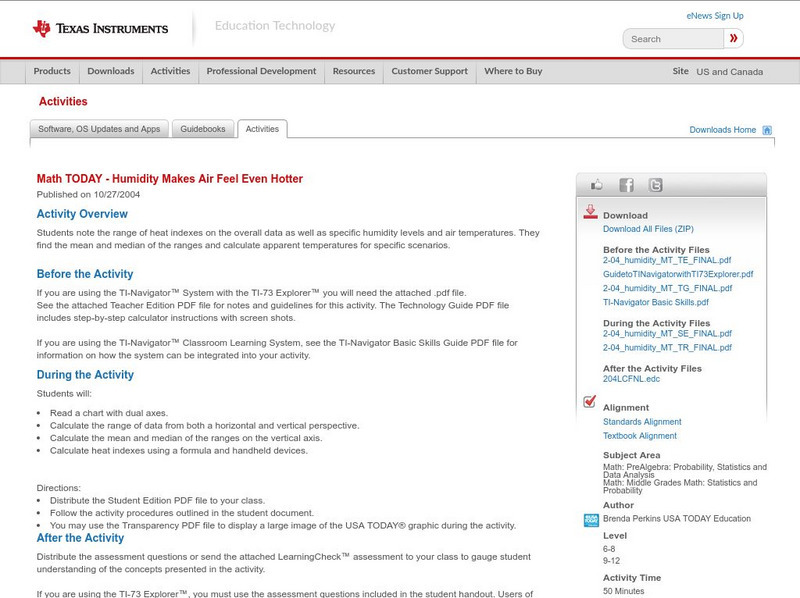
Texas Instruments: Math Today Humidity Makes Air Feel Even Hotter
Students note the range of heat indexes on the overall data as well as specific humidity levels and air temperatures. They find the mean and median of the ranges and calculate apparent temperatures for specific scenarios.
Texas Instruments
Texas Instruments: Altitude, Median, and Angle Bisector of a Triangle
In this activity, you will construct special segments of a triangle named altitudes, medians, and angle bisectors, Using their definitions. You will look at how an altitude, a median, and an angle bisector divide the area of a triangle....
Texas Instruments
Texas Instruments: Create Box and Whisker Plots
Students use a graphing calculator to create box-and-whisker plots and learn the usefulness of them. Students identify the five summary statistical values of data sets - minimum, first quartile, median, third quartile, and maximum values.
Texas Instruments
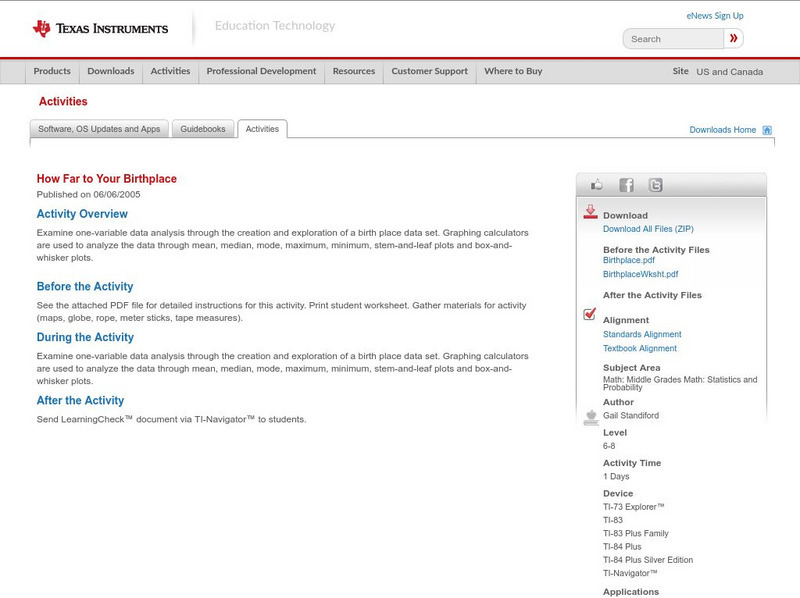
Texas Instruments: How Far to Your Birthplace
Examine one-variable data analysis through the creation and exploration of a birth place data set. Graphing calculators are used to analyze the data through mean, median, mode, maximum, minimum, stem-and-leaf plots and box-and-whisker...
Texas Instruments
Texas Instruments: Measures of Central Tendency
Mean, median, and mode are measures of central tendency in data analysis. Each can be used to identify central tendency. Box-and-whiskers plots are a visual representation of collected data involving medians.
Texas Instruments
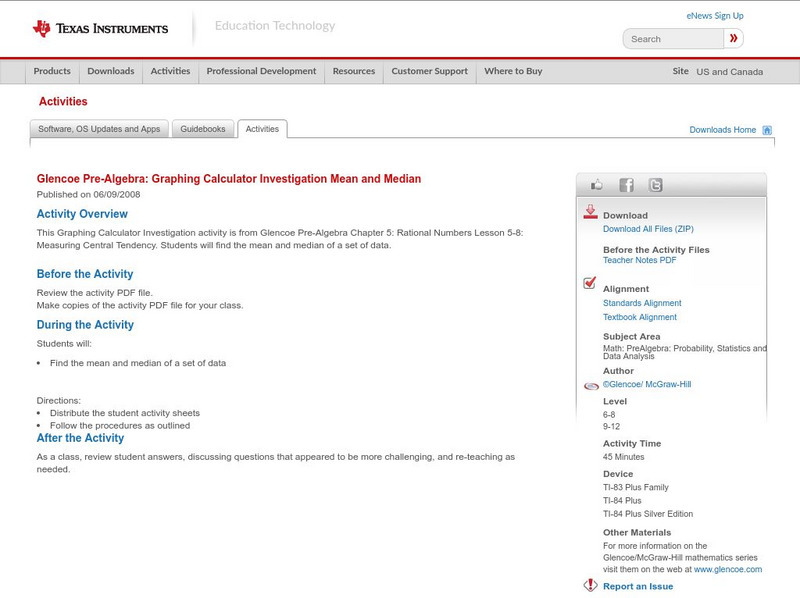
Texas Instruments: Glencoe Pre Algebra: Graphing Calculator: Mean and Median
Students will find the mean and median of a set of data.
Texas Instruments
Texas Instruments: Simple Constructions
In this skill activity, students can use the Constructions Tools Menu in Cabri Jr. to contruct a parallelogram. They will also construct an altitude, an angle bisector and a median of a triangle.
Texas Instruments
Texas Instruments: Data and Statistical Methods 1
In this set of exercises, a set of data is provided; students answer questions about mean, median, mode, and quartiles. Questions are multiple choice with solutions provided.
Texas Instruments
Texas Instruments: Women's 5000 M World Record Progression: Median Median Line
In this activity, students will collect the Women's 5000 meter progression of world record data and find the median - median line and the linear regression for the data. They will investigate the appropriateness of each of the models.
Texas Instruments
Texas Instruments: Finding Linear Models
Students graph a scatter plot, find average rate of change, develop a linear model, find a linear regression and a median/median line for a set of data graphed in a scatter plot and predict profit.
Science Education Resource Center at Carleton College
Serc: Nitrate Levels in the Rock Creek Park Watershed: Meas of Central Tendency
Activity uses water-quality data from Rock Creek Park to illustrate elementary statistical measures of exploratory data analysis. The focus of the activity is the nutrient limitation in a stream and the three measures of central tendency.
Stefan Warner and Steven R. Costenoble
Finite Mathematics & Applied Calculus: Measures of Central Tendency
Students learn about measures of central tendency. Topics explored are mean, median, mode, and expected value. The tutorial investigates the statistics concepts through class notes and examples. Review exercises and a chapter quiz are...
Stefan Warner and Steven R. Costenoble
Finite Mathematics & Applied Calculus: Mean, Median & Standard Deviation
Students learn about mean, median, variance, and standard deviation. The tutorial investigates the statistics concepts though class notes and examples. Review exercises are included.
Rice University
Hyper Stat Online Statistics Textbook: Central Tendency
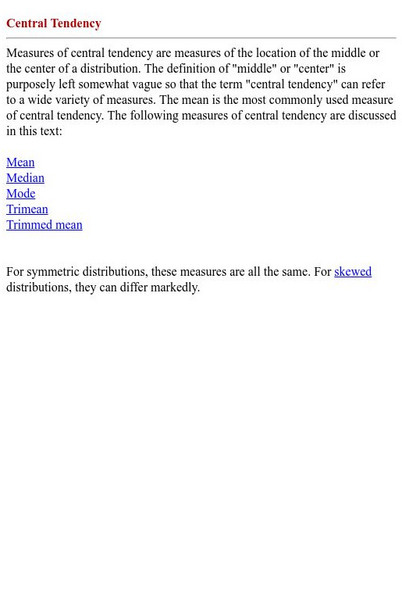
Click on mean, median, mode, trimean, or trimmed mean to review central tendency.
Beacon Learning Center
Beacon Learning Center: All That Data 2
Students describe graphs and explore range, measures of central tendency, and distribution in this interactive web lesson.
Beacon Learning Center
Beacon Learning Center: All That Data
Students analyze data by finding the mean, median, mode, and range of a set of numbers. Line plots, bar graphs, and circle graphs are also included in this lesson.
Ministry of Education and Universities of the Region of Murcia (Spain)
Ministerio De Educacion Y Ciencia: Rectas Notables De Un Triangulo
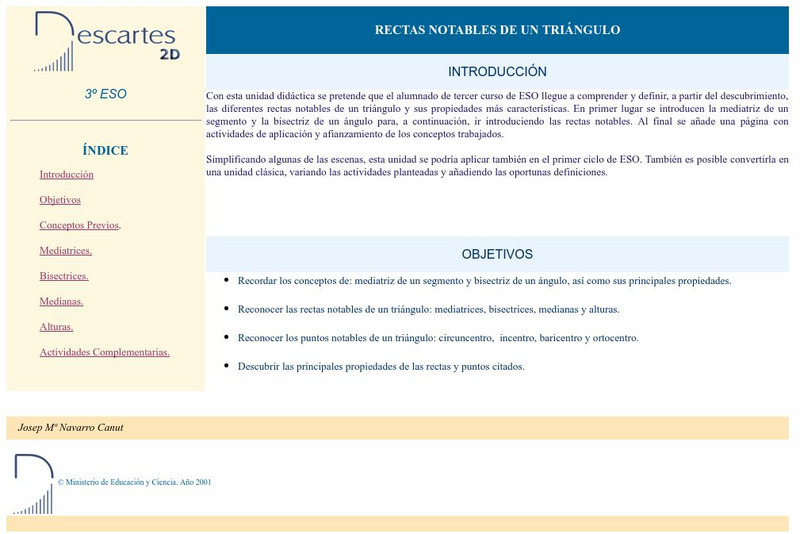
In Spanish. Interactive activities dealing with the concept of angle bisector, median and altitude of a triangle. A description of the circumcenter and centroid are given along with a visual representation. [Requires Java.]
Ministry of Education and Universities of the Region of Murcia (Spain)
Ministerio De Educacion Y Ciencia: Actividades Con Las Rectas De Un Triangulo
You will find an interactive activity to review the following concepts: altitude, median, angle bisector and points of concurrency in triangles. Five different interactive quizzes are also provided to test your knowledge.
Oswego City School District
Regents Exam Prep Center: Statistical Studies, Central Tendency, and Dispersion
The mathematics tutorial investigates statistical studies, central tendency, and dispersion. The lesson consists of class notes, calculator tips, examples, and practice problems with solutions. The teacher resource includes an activity...
Maths Challenge
Maths challenge.net: Triangle Medians
Prove that the centroid, P, splits each median into the ratio 2:1. If you give up, then in the top right corner, you may reveal the solution.
PBS
Pbs Mathline: Bubble Mania [Pdf]
Bubble Mania is a lesson plan that focuses on the concept of measurement as it applies to the diameter, circumference, and area in a bubble. Extension activities and connections, related worksheets, and additional resources are included.
Other
Stat Soft: Statistics Glossary
Dozens of statistical terms are defined and illustrated in this glossary.













![Pbs Mathline: Bubble Mania [Pdf] Lesson Plan Pbs Mathline: Bubble Mania [Pdf] Lesson Plan](https://static.lp.lexp.cloud/images/attachment_defaults/resource/large/FPO-knovation.png)
