Khan Academy
Khan Academy: Empirical Rule
Practice applying the 68-95-99.7 empirical rule. Students receive immediate feedback and have the opportunity to try questions repeatedly, watch a video or receive hints.
Khan Academy
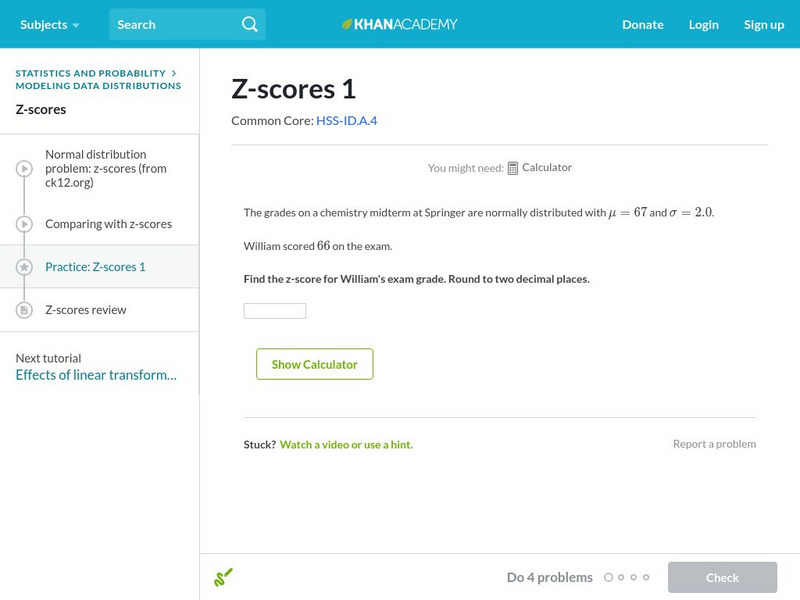
Khan Academy: Z Scores 1
Find the z-score of a particular measurement given the mean and standard deviation. Students receive immediate feedback and have the opportunity to try questions repeatedly, watch a video or receive hints.
Wolfram Research
Wolfram Math World: Correlation Coefficient
MathWorld offers a technical, yet informative, explanation of the correlation coefficient for bivariate normal distribution.
University of Cambridge
University of Cambridge: Maths and Sports: Olympic Triathlon
Do you think the triathlon will be won by someone who is very strong in one event and average in the other two, or someone who is strong in all three disciplines? This activity challenges students to analyse real-life data and use their...
Khan Academy
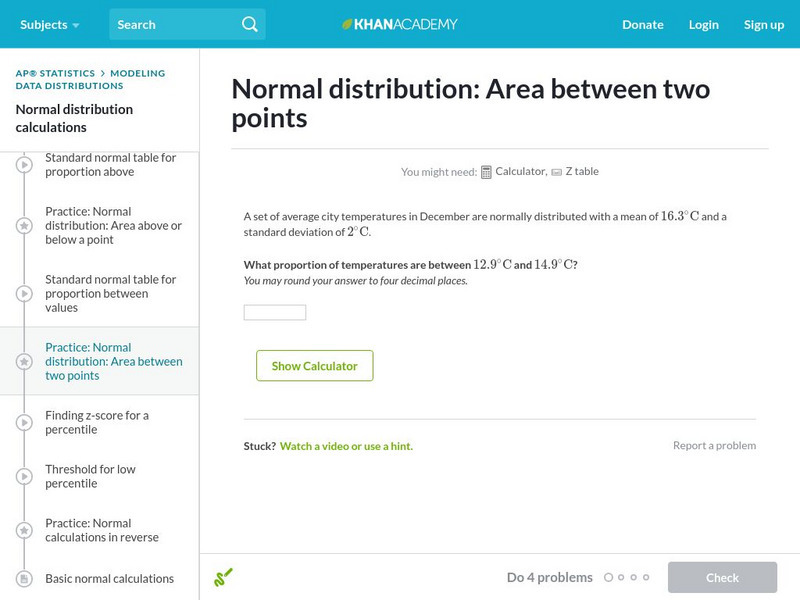
Khan Academy: Normal Distribution: Area Between Two Points
Use a z-table to find the probability that a particular measurement is in a range. Students receive immediate feedback and have the opportunity to try questions repeatedly, watch a video or receive hints.
Texas Instruments
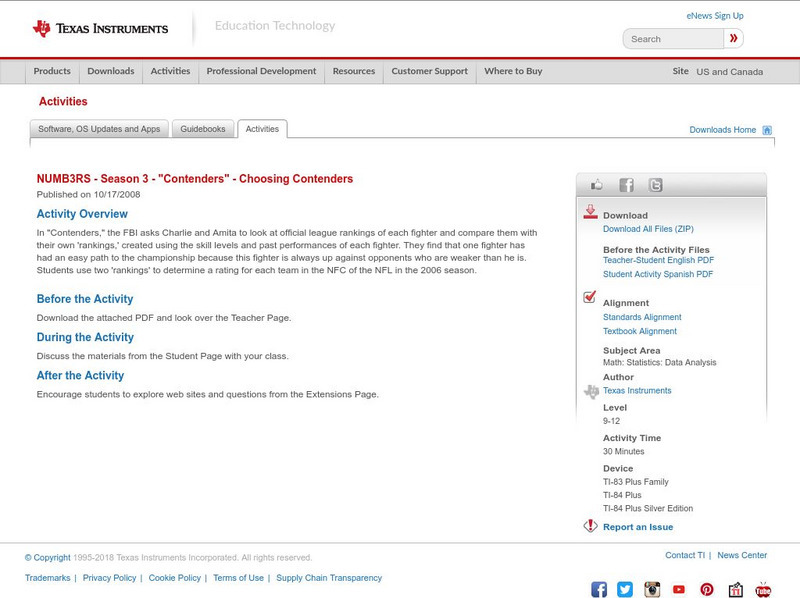
Texas Instruments: Numb3 Rs: Choosing Contenders
Based off of the hit television show NUMB3RS, this lesson shows students two different ways to "normalize" scores: by applying a created scalar factor so that all scores have a mean of one, or by using z-scores. Students are walked...
Illustrative Mathematics
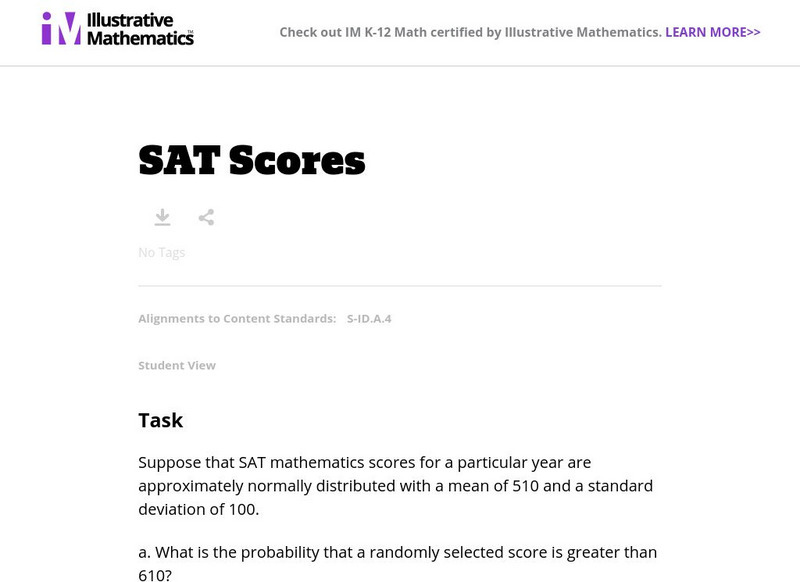
Illustrative Mathematics: S Id Sat Scores
Students will find solutions for a series of questions based on the assumption that SAT mathematics scores for a particular year are approximately normally distributed with a mean of 510 and a standard deviation of 100. Explanation and...
Illustrative Mathematics
Illustrative Mathematics: S Id.4 Do You Fit in This Car?
Students are tasked with solving a common issue for automobile manufacturers that require the students to use normal distribution as a model for data distribution. They will also use mean and standard deviation to figure out the problem....
Illustrative Mathematics
Illustrative Mathematics: S Id.4 Should We Send Out a Certificate?
Should Fred receive a certificate for scoring in the top 2.5% of a statewide standardized test? Given the test scores for a large population and the mean and standard deviation, students will decide if Fred's score is good enough....
Other
Magoosh: Statistics Fundamentals
An online course on the fundamentals of statistics including video lessons in Mean, Median, and Mode; Weighted Averages; Quartiles and Boxplots; Range and Standard Deviation; Normal Distribution; Z-scores; Intro to Inferential...
CK-12 Foundation
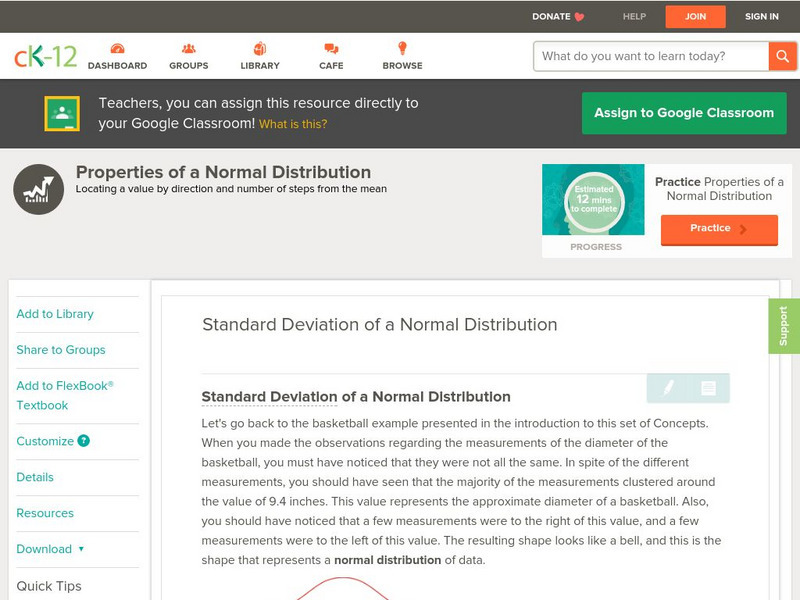
Ck 12: Statistics: Standard Deviation of a Normal Distribution
[Free Registration/Login may be required to access all resource tools.] Learn about the spread of a normal distribution.
CK-12 Foundation
Ck 12: Statistics: Density Curve of the Normal Distribution
[Free Registration/Login may be required to access all resource tools.] This Concept expands upon the previous by discussing further the normal distribution and the probabilities associated with it by looking at the normal density curve.
Mathigon
Mathigon: Probability and Discrete Math: Predicting the Future
This lesson focuses on probability theory for predicting the outcome of flipping a coin, and then flipping it multiple times.
Shodor Education Foundation
Shodor Interactivate: Normal Distribution
Change the standard deviation of an automatically generated normal distribution to create a new histogram. Observe how well the histogram fits the curve, and how areas under the curve correspond to the number of trials.
Shodor Education Foundation
Shodor Interactivate: Overlapping Gaussians
In this applet you can adjust the parameters on two Gaussian curves to determine if there is a possibility of a difference between the two means.
Khan Academy
Khan Academy: Basic Normal Calculations
Many measurements fit a special distribution called the normal distribution.
Khan Academy
Khan Academy: Comparing Data Distributions
Take a look at two different data distributions and draw some comparisons.
CK-12 Foundation
Ck 12: Algebra Ii: 6.2 the Tails of a Distribution
This section introduces the idea of the tails of a distribution, and provides exercises to help you become proficient in determining the type of test associated with various situations.
CK-12 Foundation
Ck 12: Algebra Ii: 5.3 Normal Distribution
This section explores normal distribution curves that have a unique, bell-like shape and represent data that is "normally" distributed. It also addresses how many real-life situations can be modeled by normal distribution curves.
Khan Academy
Khan Academy: Normal Distributions Review
Normal distributions come up time and time again in statistics. A normal distribution has some interesting properties: it has a bell shape, the mean and median are equal, and 68% of the data falls within 1 standard deviation.
Hofstra University
Hofstra University: Review Exercises Random Variables..
Interactive review problems are offered to practice the concepts of random variables and statistics. Topics covered include, Bernoulli trials, normal and binomial distributions, Chebyshev's rule, and the like.
Wolfram Research
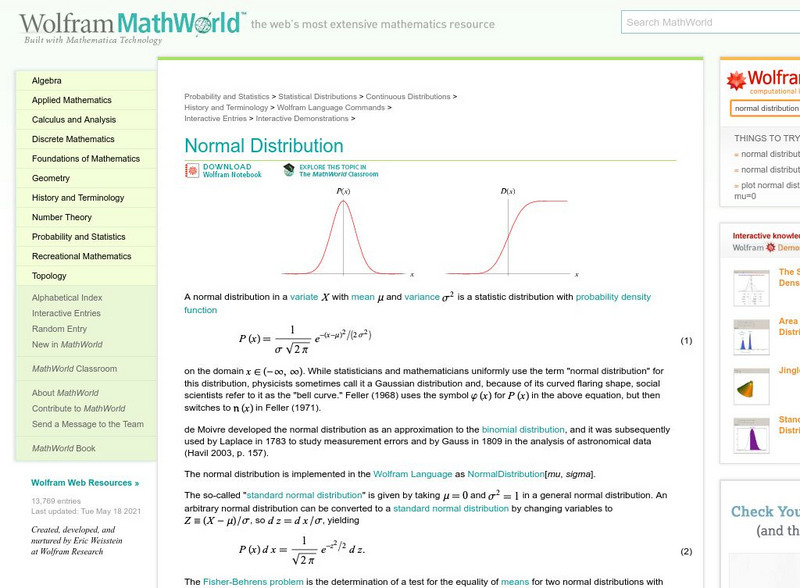
Wolfram Math World: Normal Distribution
Math World explains the normal distribution with links to help with unfamiliar topics and terms. The site explains how to convert from a normal distribution to a standard normal distribution. Some prior knowledge of statistics and normal...
California State University
Cal State San Bernardino: Central Limit Theorem Applet
In this applet, rolling of dice is studied. The number that lands face "up" on the die is graphed as the die is rolled repeatedly. The user begins to see, with increased accuracy, the standard normal curve appearing as the graph.
Other
Berrie's Statistics Page: Graph of Normal Distribution
Explanation of the Normal Curve and the importance of the normal distribution

