Hi, what do you want to do?
Curated OER
How Do You Use a Scatter Plot to Find a Line of Fit?
What is a line-of-fit? Given a data set, plot the ordered pairs on a graph. It looks like a scatter plot. Now estimate, and draw a line that best fits what the data represents. That is your line-of-fit.
Virtual Nerd
Virtual Nerd: How Do You Use a Scatter Plot to Find a Line of Fit
In this video lesson students learn how to graph data on a coordinate plane and draw a line of fit for that data.
Texas Education Agency
Texas Gateway: The Median Median Line and Least Absolute Value Line
This lesson explains how to use the median-median line to fit a line to data when there are outliers away from the general pattern. Includes downloadable study guide with exercises - guide also covers other topics. [18:59]
Loyola University Chicago
Math Flix: Graphs: Scatter Plot Decoding
This QuickTime movie provides an opportunity to create a data table by analyzing a scatter plot. As you watch and listen to the teacher and student interact it helps clarify the thinking behind applying this concept.
Virtual Nerd
Virtual Nerd: How Do You Write and Use a Prediction Equation?
This tutorial illustrates how to draw a line of fit on a scatter plot and find the equation of that line in order to make a prediction based on the data already given. [6:47]
Sophia Learning
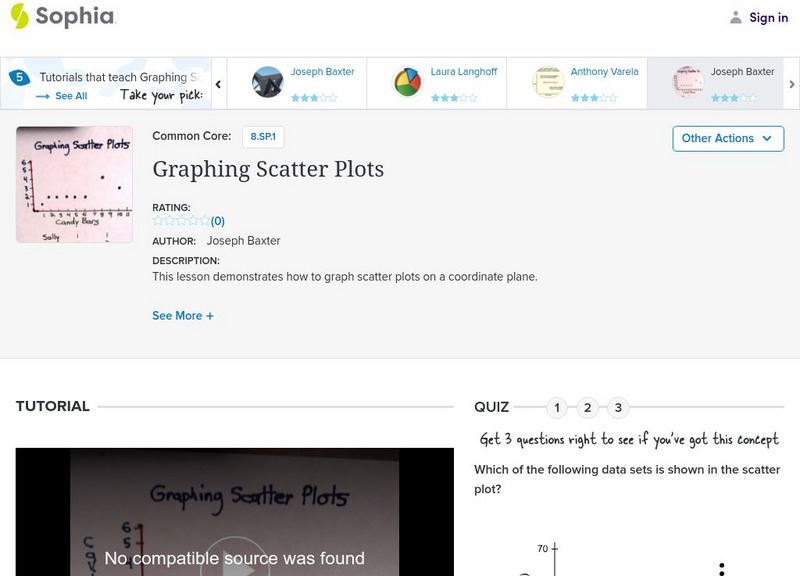
Sophia: Graphing Scatter Plots
Use collected data to graph scatter plots on a coordinate plane. Take quiz to check understanding.
Sophia Learning
Sophia: Graphing Scatter Plots
Create a scatter plot by displaying data on a coordinate plane. Assess understanding with a quiz.
Sophia Learning
Sophia: Interpreting Scatter Plots
Determine whether data has a positive, negative, or no correlation using scatter plots. Assess learning with a quiz.
Sophia Learning
Sophia: Interpreting Scatter Plots
Explore the relationships between given data using scatter plots and determine whether the correlation is negative, positive, or no correlation. Assess learning with a quiz.
Crash Course
Crash Course Statistics #8: Correlation Doesn't Equal Causation
This episode talks about data relationships and what we can learn from them. We'll focus on correlation, which is a measure of how two variables move together, and we'll also introduce some useful statistical terms you've probably heard...
Khan Academy
Khan Academy: Estimating the Line of Best Fit
In this video lesson, students estimate the line of best fit from a scatter plot. [1:16]
Khan Academy
Khan Academy: Interpreting a Trend Line
In this video lesson students learn to use a line of best fit to interpret data from a scatter plot.
Khan Academy
Khan Academy: Bivariate Relationship Linearity, Strength and Direction
Describe a bivariate relationship's linearity, strength, and direction.
Sophia Learning
Sophia: Correlation: Lesson 2
This lesson defines correlation as the relationship between variables presented on a scatter plot. This is part of a series of lessons about topics related to scatter plots. It is 2 of 9 in the series titled "Correlation.' [3:31]
Khan Academy
Khan Academy: Scatter Plots: Studying, Shoe Size, and Test Scores
Presents a problem with two graphs: study time vs. test score and shoe size vs. test score. Discusses the linear and nonlinear relationships that the graphs show. [2:26]


