Hi, what do you want to do?
Curated OER
Border Math
Pupils examine and interpret data relating to U.S.-Mexico borderland realities, and consider such aspects of social science as the study of population, crime, government spending, pollution, health, and economics.
Curated OER
Trusting Statistics Lesson Plan
Students read a section of the Runaway Journey narrative and conduct a survey. They use survey statistics to question their validity and decide why a respondent might not answer truthfully.
Curated OER
Trusting Statistics Lesson Plan
Students read a section of the Runaway Journeys narrative. They discuss why statistics might be inaccurate, write and implement their own survey, and explain how they gave their survey to get results they wanted.
Curated OER
The Guise of a Graph Gumshoe
Eighth graders practice constructing bar, circle, and box-and-whisker graphs. They practice reading and interpreting data displays and explore how different displays of data can lead to different interpretations.
Curated OER
You Are What You Eat (High School)
Students evaluate data from a statistical chart or graph which they find in a newspaper or magazine.
Curated OER
Statistically Lyrical
Students examine and discuss the writing of ratios as fractions and where they can be found in the real world. They complete worksheets and a questionnaire, and calculate the mean, median, and mode scores for the class.
Curated OER
Using Statistics to Uncover More Evidence
Fifth graders participate in an online Web lesson plan on ways of interpreting data. They conduct a survey and interpret the results in a journal entry.
Curated OER
Discovering Demographics
High schoolers analyze demographic data including a statistical overview of India. Students synthesize their findings and create an informational poster about India.
Curated OER
The Birthday Problem
Students try to solve the birthday problem: Given a group of people, what is the probability of two people in the group having the same birthday?
Curated OER
How Are Students Doing on the AP exams?
Students compile and analyze data pertaining to College Credit AP Exams. They pose questions - Which exam is the easiest? - determine answers from their data and display their results.
Curated OER
Population Ratios
Students access web site and record various population statistics pertaining to a county in the USA of their choice. They use this data to set up and solve ratios. They compare data to make meaning of the numbers.
Curated OER
Statistics and Shopping
Pupils examine statistics and data analysis concepts from the practical questions that arise in everyday life.
Curated OER
Neighborhood statistics
Students examine statistics relating to neighborhoods. They use the data to explain how a population affects their environment. They discuss how businesses use statistics to find out information about their clientele.
Curated OER
Mapping the changes in Canada's population
Students find and analyze data found in the census. They compare the population from 1996 to 2001. They explore the type of data they can find in the Census of Population.
Curated OER
The Household Environment Survey
Students examine data collected from a national survey of household environmental practices to develop their own questionaires. Once they have their own survey questions, students conduct their own investigations, and report their findings.
Curated OER
Distribution of children living at home
High schoolers examine census data to evaluate the number of students of certain ages living at home. This data is then used to determine the need for day care, or other social programs. They use this information to explore social policies.
Curated OER
Successful Resource-based Learning Strategies for the Geography of Canada Course
Learners conduct a statistical research project on population changes. They evaluate demographic issues, such as the size and location of native people. immigrant groups, and the age and gender of the population.
City University of New York
Scientific Method and Probability: Interactive Activity
This interactive lesson begins with the basics and carries through to methods of data analysis, all interactively. Supporting material is excellent.
Mathematics Archives
Math Archives: Linear Equation Programs
This site contains a downloadable tool that can solve up to 30 simultaneous linear equations in 30 unknowns.
Massachusetts Institute of Technology
Mit: Open Course Ware: Introduction to Probability and Statistics
The online course consists of educational materials about probability and statistics. Lecture notes, exams, and assignments are included.
University of South Florida
Fcat: Drops on a Penny: Teacher Notes
Students learn how to create stem-and-leaf diagrams and boxplots by collecting data on the surface tension of water molecules. This hands-on activity using pennies is a great way to learn how to organize data.
Science Buddies
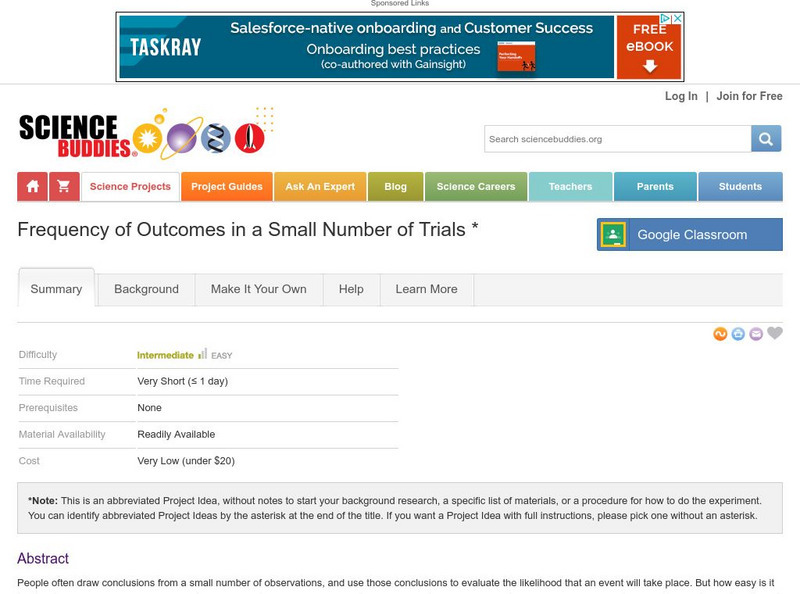
Science Buddies: Frequency of Outcomes in a Small Number of Trials
People often draw conclusions from a small number of observations, but how easy is it to draw the wrong conclusion? Here is a simple project that shows the importance of making enough observations before making a prediction.
University of Texas at Austin
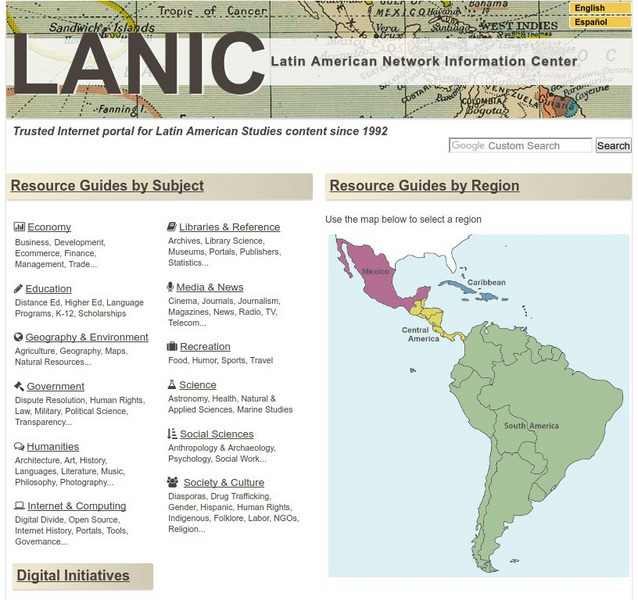
Lanic: Latin American Network Information Center
Vast network of information from and about Latin America is provided. Major topic headings include countries, economy, education, government, humanities, science, social sciences, society and culture, recreation, media and communication,...
Environmental Education for Kids
Eek!: Canada Goose
Read all about Canadian geese at this fun and interesting site! What do Canadian geese look like? How do they behave? Where do they live? Learn the answers to all of these questions, and more!


