Hi, what do you want to do?
Other
Clayton State: Linear Regression
Introductory look at linear regression. Notes presented in outline form, with key concepts and formulas given. An example is presented at the end.
The Franklin Institute
The Franklin Institute: Heart Health and Care
This is a simple guide from The Franklin Institute to keeping your heart healthy through proper exercise, a varied diet, and a clean lifestyle. Here, read about how to exercise and eat to avoid heart disease.
McGraw Hill
Glencoe: Two Way Tables [Pdf]
This portion of an online textbook provides examples of two-way tables, vocabulary and practice problems.
Ministry of Education and Universities of the Region of Murcia (Spain)
Ministerio De Educacion Y Ciencia: El Azar Y La Probabilidad
In Spanish. Interactive activities introducing some of the concepts of probability.
PBS
Pbs Teachers: Tree Mendous Plots [Pdf]
To teach students how to use collect and use real-life data, use this lesson to create, populate and analyze graphs to interpret data related to the growth of plants from seeds. The lesson then asks students to create a story about the...
PBS
Pbs Teachers: Earth Day: What We Do Adds Up
Explore averages and rates of change and apply to calculate the cumulative effect of garbage thrown out by people over time. Use population data from the U.S. Bureau of Census to estimate how much garbage your county threw away during...
The Franklin Institute
Frankin Institute Online: Group Graphing
This site from The Franklin Institute explores how to make a simple graph using a spreadsheet to portray survey data. It also gives a set of interesting sports-related web sites so that students can get statistical inforamtion.
Ministry of Education, Sports & Culture (Samoa) Government
Mesc: Samoa School Net: Mean, Median, Mode
A 2-part learning module on mean, median, and mode. Explains their definitions and discusses how to choose which term to best describe your data. Includes many well-illustrated examples. (There are a few typos, and money amounts are in...
McGraw Hill
Glencoe Mathematics: Online Study Tools: Statistics and Probability
The online test demonstrates knowledge of the concepts used in Algebra I. The multiple choice questions assess students on statistics and probability. Topics include biases, samples, and surveys.
University of Cambridge
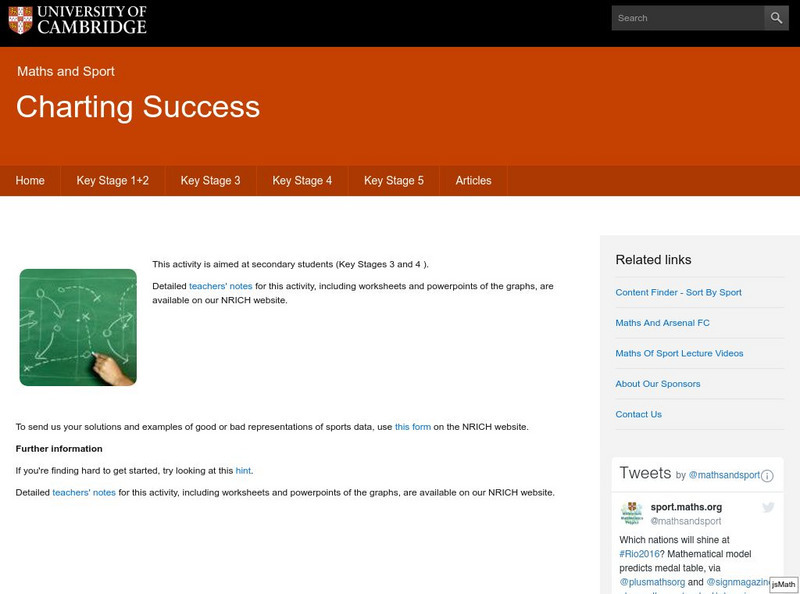
University of Cambridge: Maths and Sports: Charting Success
Sports statisticians, trainers and competitors create graphs, charts and diagrams to help them to analyse performance, inform training programmes or improve motivation. This activity encourages students to consider and analyse...
University of Cambridge
University of Cambridge: Maths and Sports: Our Sports
What events are there in your school sports day, and in the Olympic Games? What are your favourite races and sports? This activity encourages discussion and decisions about how to collect and display data, and is designed to be...
Illustrative Mathematics
Illustrative Mathematics: 6 Sp.2,5d Electoral College
In addition to providing a task that relates to other disciplines (history, civics, current events, etc.), this task is intended to demonstrate that a graph can summarize a distribution as well as provide useful information about...
Science Education Resource Center at Carleton College
Serc: Understanding the Standard Deviation: What Makes It Larger or Smaller?
Students develop a better intuitive understanding of what is meant by variability in statistics. Emphasis is placed on the standard deviation as a measure of variability.
Science Education Resource Center at Carleton College
Serc: Using an Applet to Demonstrate a Sampling Distribution
In this activity students are exposed to the concept of sampling distributions by creating an example as a class. By having the students assemble the data, they can more readily understand that a sampling distribution is made up of a...
Mangahigh
Mangahigh: Data: Listing All Possible Outcomes
Students learn about the concept of possible outcomes by exploring a tutorial. They can then test their knowledge by taking a ten question assessment that increases in difficulty as they correctly answer questions.
Mangahigh
Mangahigh: Data: Find the Mode
Students learn about the concept of mode by exploring a tutorial. They can then test their knowledge by taking a ten question assessment that increases in difficulty as they correctly answer questions.
Mangahigh
Mangahigh: Data: Find the Median
Students learn about the concept of median by exploring a tutorial. They can then test their knowledge by taking a ten question assessment that increases in difficulty as they correctly answer questions.
Mangahigh
Mangahigh: Data: Find the Median From a Table
Students learn about the concept of median by exploring a tutorial. They can then test their knowledge by taking a ten question assessment that increases in difficulty as they correctly answer questions.
Mangahigh
Mangahigh: Data: Find the Mean
Students learn about the concept of mean by exploring a tutorial. They can then test their knowledge by taking a ten question assessment that increases in difficulty as they correctly answer questions.
Mangahigh
Mangahigh: Data: Find the Mean From a Table
This site provides students practice with the concept of finding the mean. Students can learn about the topic by completing an interactive tutorial. Students can then take a ten question timed test to practice the skill.
Mangahigh
Mangahigh: Data: Estimate the Mean Using Grouped Results
Students watch an online tutorial on the concept of estimating the mean. After watching, students test their knowledge by attempting ten practice problems that increase or decrease in difficulty based on their answers.
Mangahigh
Mangahigh: Data: Use the Mean to Solve Problems
This site provides students practice with the concept of mean. Students can learn about the topic by completing an interactive tutorial. Students can then take a ten question timed test to practice the skill.
Mangahigh
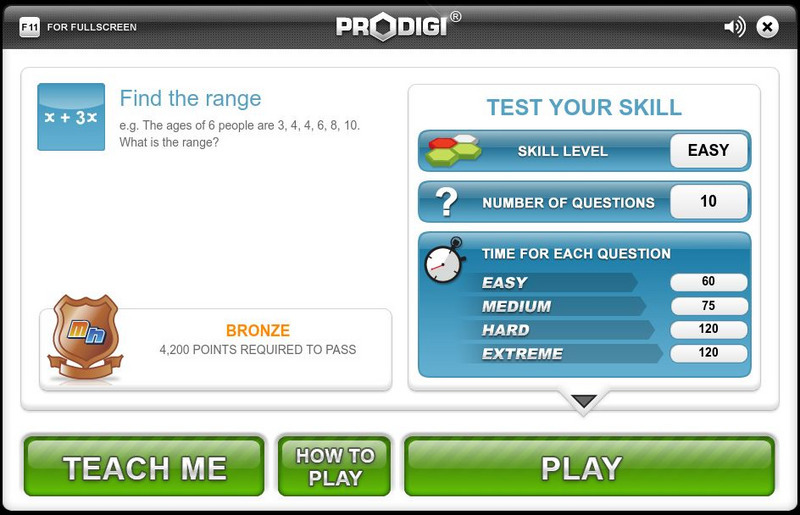
Mangahigh: Data: Find the Range
Students learn about the concept of range by exploring a tutorial. They can then test their knowledge by taking a ten question assessment that increases in difficulty as they correctly answer questions.
Mangahigh
Mangahigh: Data: Find the Quartiles and Interquartile Range
This site provides students practice with the concept of interquartile range. Students can learn about the topic by completing an interactive tutorial. Students can then take a ten question timed test to practice the skill.


![Glencoe: Two Way Tables [Pdf] eBook Glencoe: Two Way Tables [Pdf] eBook](https://content.lessonplanet.com/knovation/original/108238-00003273f53572e51290174e1a53eb12.jpg?1661187814)

![Pbs Teachers: Tree Mendous Plots [Pdf] Lesson Plan Pbs Teachers: Tree Mendous Plots [Pdf] Lesson Plan](https://content.lessonplanet.com/knovation/original/114247-36948766618258b08210c17f84fd1d88.jpg?1661419217)


