Hi, what do you want to do?
CK-12 Foundation
Ck 12: Statistics: Quartiles
[Free Registration/Login may be required to access all resource tools.] Order a set of data and understand the measures needed for a box-and-whisker plot.
CK-12 Foundation
Ck 12: Statistics: Data Display Choices Grades 6 7
[Free Registration/Login may be required to access all resource tools.] Create surveys and display data using different types of graphs.
CK-12 Foundation
Ck 12: Statistics: Data Display Choices Grade 7
[Free Registration/Login may be required to access all resource tools.] Associate given conclusions about a set of data given different displays of data.
CK-12 Foundation
Ck 12: Statistics: Dependent Events and Sample Spaces Grades 9 10
[Free Registration/Login may be required to access all resource tools.] Covers the Multiplication Rule for dependent events.
CK-12 Foundation
Ck 12: Statistics: Independent Events and Sample Spaces
[Free Registration/Login may be required to access all resource tools.] Covers the multiplication rule for independent events.
CK-12 Foundation
Ck 12: Statistics: Binomial Distributions
[Free Registration/Login may be required to access all resource tools.] Covers binomial distributions.
CK-12 Foundation
Ck 12: Statistics: Identification of Misleading Statistics Grade 7
[Free Registration/Login may be required to access all resource tools.] Identify and analyze misleading statistics.
CK-12 Foundation
Ck 12: Statistics: Range of Spread/dispersion
[Free Registration/Login may be required to access all resource tools.] Determine the range of a given set of data.
CK-12 Foundation
Ck 12: Statistics: Range of Spread/dispersion
[Free Registration/Login may be required to access all resource tools.] Find the range of a set of data.
CK-12 Foundation
Ck 12: Statistics: Stem and Leaf Plots, Mean, Median, and Mode
[Free Registration/Login may be required to access all resource tools.] Find the mean, median, and mode of a set of data displayed in a stem-and-leaf plot.
CK-12 Foundation
Ck 12: Statistics: Stem and Leaf Plots, Range of a Data Set
[Free Registration/Login may be required to access all resource tools.] Find the range of a set of data displayed in a stem-and-leaf plot.
CK-12 Foundation
Ck 12: Statistics: One Way Anova Tests
[Free Registration/Login may be required to access all resource tools.] This Concept demonstrates how to use ANOVA to compare multiple means as pairs of hypotheses.
Sophia Learning
Sophia: Box and Whisker Plots
Explore how to display data using a box and whisker plot.
Sophia Learning
Sophia: Facts
This lesson clarifies what writers mean when using the term "facts." This tutorial lesson shares a short slideshow with the lesson's content.
Sophia Learning
Sophia: Measure of Variation
Explore the measures of variation and check understanding with an assessment.
Sophia Learning
Sophia: Supporting Details: Facts and Statistics
This lesson discusses how statistics can be used as supporting details. This tutorial shares a short audio lesson [05:16] and supplemental notes with the lesson's content.
CK-12 Foundation
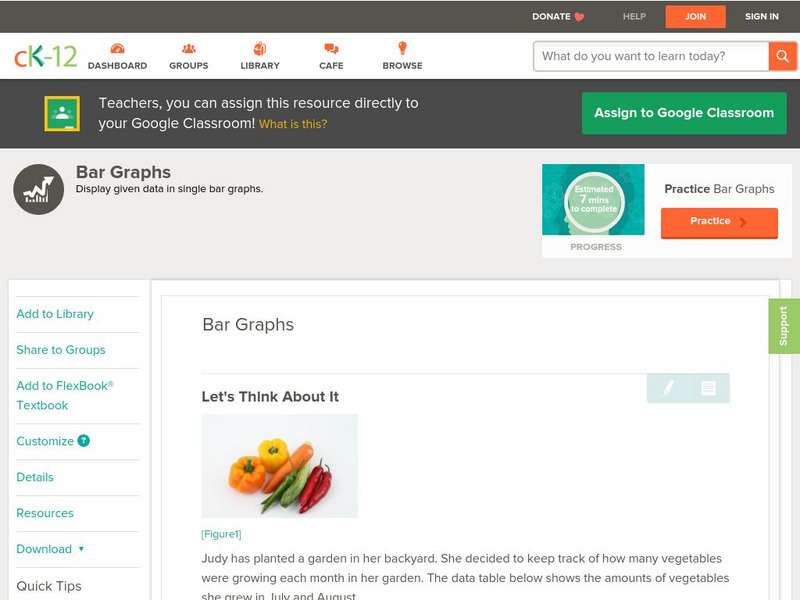
Ck 12: Statistics: Bar Graphs Grades 9 10
[Free Registration/Login may be required to access all resource tools.] Make a bar graph to display given data.
CK-12 Foundation
Ck 12: Statistics: Double Bar Graphs Grades 9 10
[Free Registration/Login may be required to access all resource tools.] Covers double bar graphs.
CK-12 Foundation
Ck 12: Statistics: Median Grades 9 10
[Free Registration/Login may be required to access all resource tools.] Find the median of a set of data.
CK-12 Foundation
Ck 12: Statistics: Mode
[Free Registration/Login may be required to access all resource tools.] Find the mode of a set of data.
CK-12 Foundation
Ck 12: Statistics: Multiple Line Graphs
[Free Registration/Login may be required to access all resource tools.] Make multiple line graphs to display and compare given data.
CK-12 Foundation
Ck 12: Statistics: Planning and Conducting Surveys
[Free Registration/Login may be required to access all resource tools.] Design and conduct surveys and analyze and interpret the results.
Texas Instruments
Texas Instruments: Statistical Graphs & Economics
What types of statistical graphs are there and when and how are they used and read? How are statistical graphs used in Economics?
Other
Vlps: Mean and Standard Deviation
Explanation of frequency distributions, mean, standard deviations, and variance including a Java Applet.


