Hi, what do you want to do?
SMART Technologies
Smart: Sampling and Misleading Graphs
Teachers can use Smart Exchange to download a SMART Notebook lesson covering the topic of sampling and misleading graphs.
Rice University
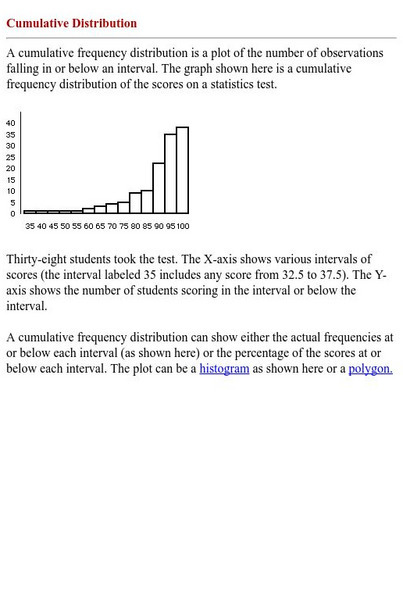
Hyper Stat Online Statistics Textbook: Cumulative Distribution
This resoruce explains how to read a cumulative frequency distribution graph.
Rice University
Hyper Stat Online Statistics Textbook: Arithmetic Mean
This resource gives a definition of a mean and provides a formula for finding a statistical mean.
Rice University
Hyper Stat Online Statistics Textbook: Median
This resource gives a definition of a median and tells you how to compute it.
University of Glasgow
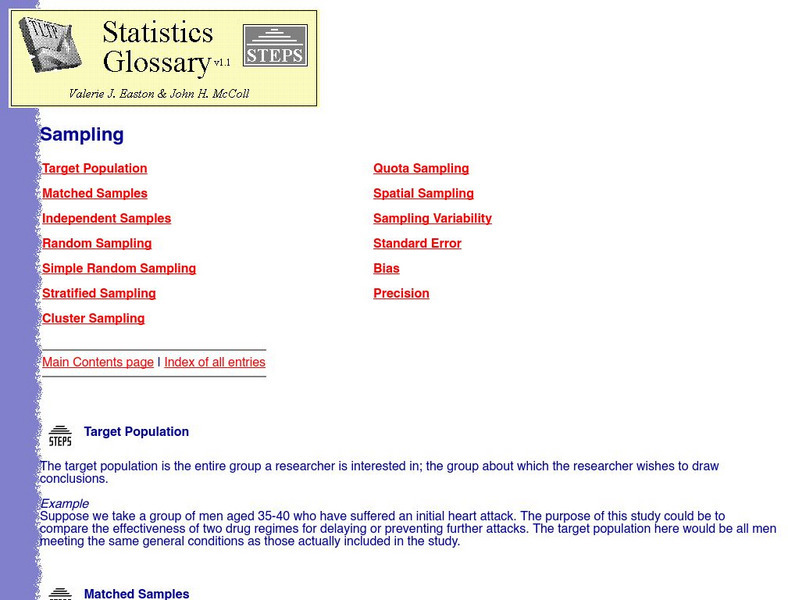
Statistics Glossary: Stratified Sampling
An online statistics glossary which contains the definition for stratified sampling. Lists reasons for using stratified sampling instead of simple random sampling and gives an example situation in which stratified sampling may be used.
Rice University
Hyper Stat Online Statistics Textbook: Summary of Measures of Central Tendency
Site discusses which method of central tendency is most appropriate for different purposes.
PBS
Pbs Teachers: Whirlybirds [Pdf]
Predict and determine the frequency of an event and measure to the nearest centimeter while constructing whirlybirds in a simulation of a parachute jump competition.
University of Baltimore
University of Baltimore: Short History of Probability & Statistics
Several brief paragraphs give a short account of the history of the study of probability and statistics. Also included are many additional resources for referencing. Written by Dr. Hossein Arsham
Other
College of Natural Sciences: Measures of Location
Different measures of location are discussed in terms of box and whisker plots.
US Department of Education
National Center for Education Statistics: Nces Classroom
Just what is the NCES Students' Classroom? In addition to many useful features, this site provides math and statistical activities tailored to a middle and elementary school students.
Soft Schools
Soft Schools: Outliers
On this websites students explore the concept of outliers. Students are given several data sets and investigate how outliers can effect the mean and median of a data set.
Sophia Learning
Sophia: Converting Between Odds and Probability: Lesson 1
This lesson demonstrates how to convert between odds and probability. It is 1 of 5 in the series titled "Converting Between Odds and Probability."
Sophia Learning
Sophia: Converting Between Odds and Probability: Lesson 4
This lesson demonstrates how to convert between odds and probability. It is 4 of 5 in the series titled "Converting Between Odds and Probability."
Illustrative Mathematics
Illustrative Mathematics: What's Your Favorite Subject
This website provides a task in which students interpret data in a two way table by calculating the relative frequencies of a data set.





![Pbs Teachers: Whirlybirds [Pdf] Lesson Plan Pbs Teachers: Whirlybirds [Pdf] Lesson Plan](https://static.lp.lexp.cloud/images/attachment_defaults/resource/large/FPO-knovation.png)
