Curated OER
Usage and Interpretation of Graphs
Students review graphing and use processing skills to solve problems.
Curated OER
How Different Are We from Other Students?
Fifth graders make bar graphs from data that they have collected. They have been writing to pen pals in Spain for a couple of months and received a survey back from them. They put all the data together that they collected.
Shodor Education Foundation
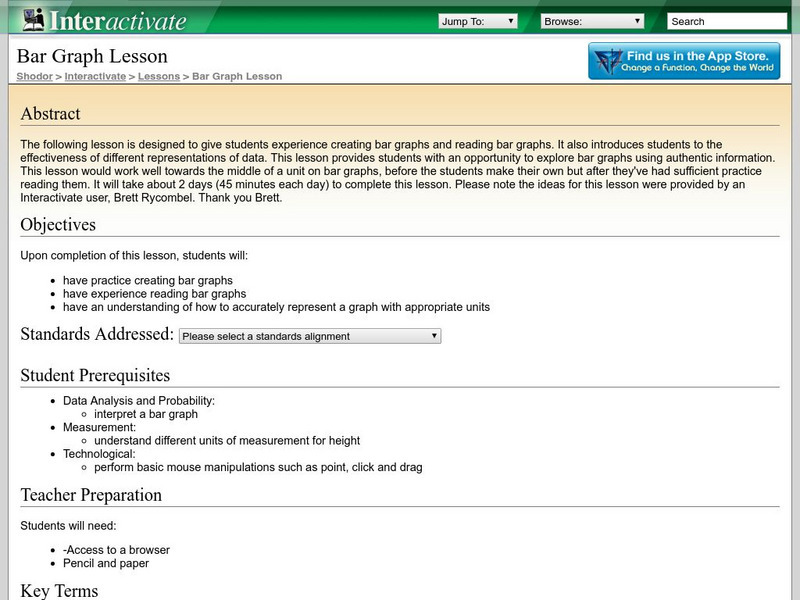
Shodor Interactivate: Lesson: Bar Graph
This instructional activity is designed to give students practice creating and reading bar graphs as well as understanding how to accurately represent a graph with appropriate units.
Shodor Education Foundation
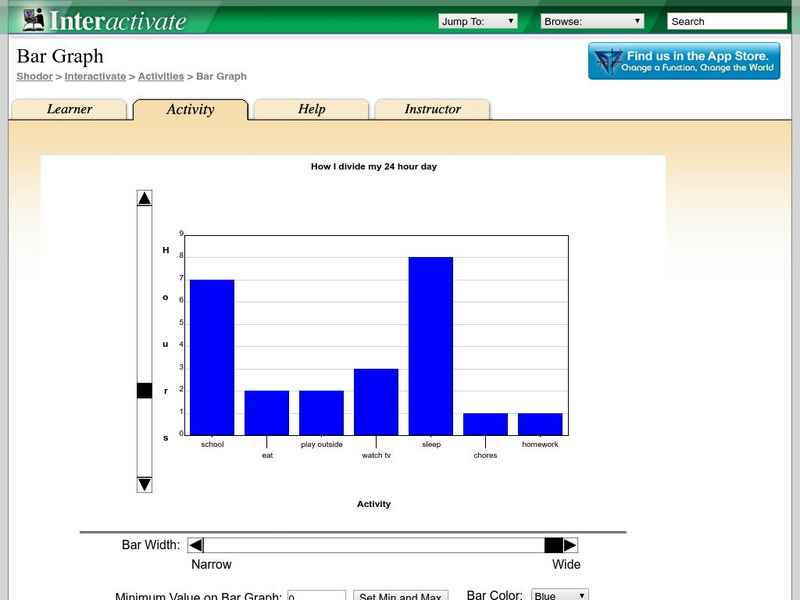
Shodor Interactivate: Bar Graph
A wonderful tool and learning experience using a bar grapher. This site contains an interactive bar grapher and much more! Follow the "What?" link to get to classroom resources such as problems and explorations.
PBS
Pbs Learning Media: Raising the Bar
Harry and Bianca's new boss at a concession stand uses bar graphs to keep records of their refreshment sales in this video from Cyberchase.
TeachEngineering
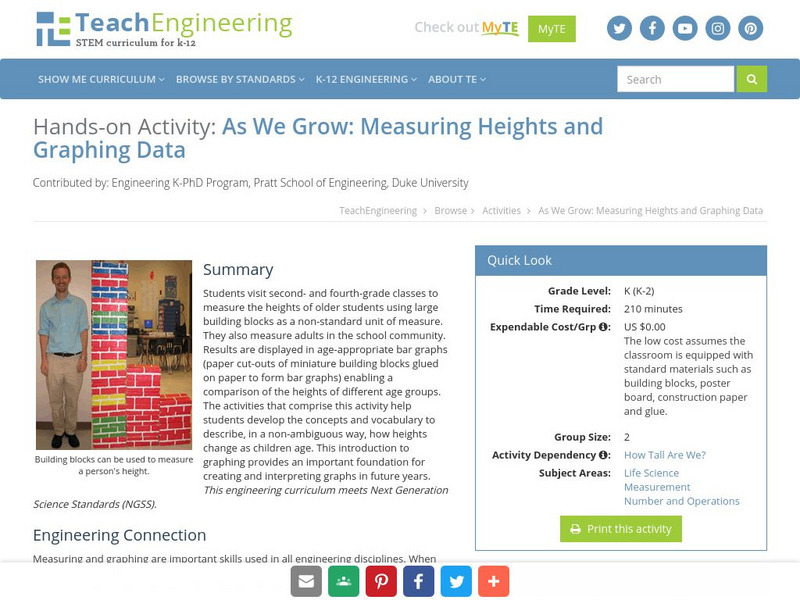
Teach Engineering: Growing and Graphing
Students visit a 2nd and a 4th grade class to measure the heights of older students using large building blocks as a non-standard unit of measure. They can also measure adults in the school community. Results are displayed in...
TeachEngineering
Teach Engineering: A Tasty Experiment
Students conduct an experiment to determine whether or not the sense of smell is important to being able to recognize foods by taste. They do this by attempting to identify several different foods that have similar textures. For some of...
That Quiz
That Quiz: Practice Test: Graphs
This resource allows users to test their knowledge of graphs and graphing methods.
US Department of Education
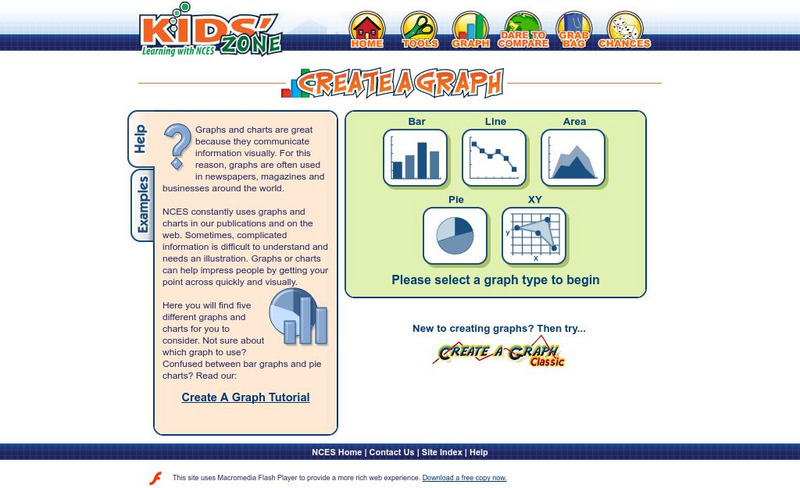
Nces Kids' Zone: Create a Graph
Resource from the National Center for Education Statistics allows you to create great bar graphs. Simply enter your information, choose appropriate colors, and voila!- you have a beautiful graph you can turn put into your report!
Texas Education Agency
Texas Gateway: Analyze Graphical Sources: Practice 2 (English I Reading)
This lesson focuses on practice exercises to understand and interpret the data in a graphic representations including pie charts, bar graphs, and line graphs.
TeachEngineering
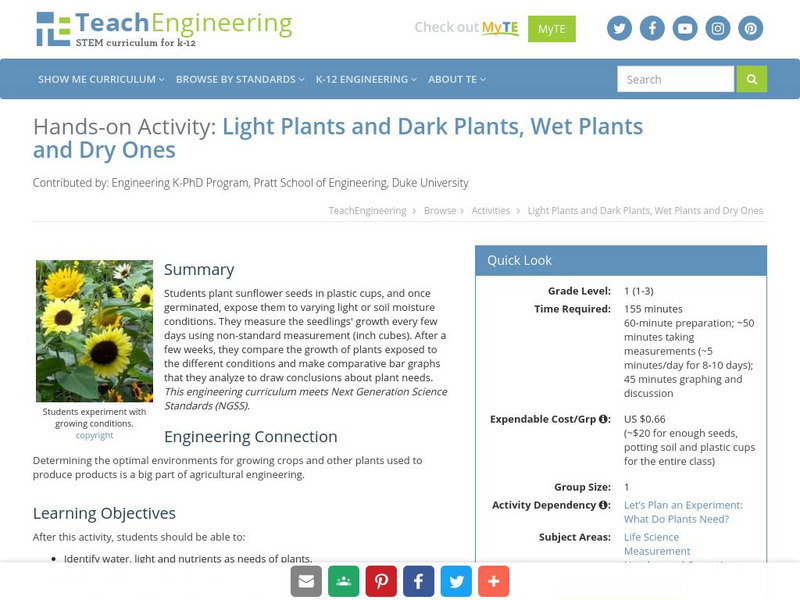
Teach Engineering: Light Plants and Dark Plants, Wet Plants and Dry Ones
Students plant sunflower seeds in plastic cups, and once germinated, these are exposed to different conditions of light levels and/or soil moisture contents. During exposure of the plants to these different conditions, students measure...
PBS
Pbs Kids Afterschool Adventure!: Operation: Data Saves the Day Activity Plan
Data comes to the rescue! Children will collect, analyze, and represent data as they try to dodge a series of catastrophes faced by characters from their favorite PBS Kids shows.
Scholastic
Scholastic: Bars, Lines, and Pies
Students will learn and reinforce skills for creating, applying and analyzing pie charts, bar graphs and line graphs.
University of Regina (Canada)
University of Regina: Math Central: Circle and Bar Graphs
Students evaluate data, use the data to make different types of graphs, and then investigate these graphs. Teacher's notes are included along with downloadable versions of the activity. This lesson is from a group of lessons that uses...
Texas Instruments
Texas Instruments: Quick Stats With Quick Poll
It's so simple. Since Quick Poll gives a bar graph when a poll is taken, the teacher can use these graphs to do all kinds of neat statistical manipulations with the students.
abcteach
Abcteach: Dinosaurs
[Free Registration/Login Required] This resource features a variety of activities related to dinosaurs. There are interdisciplinary tasks that include writing exercises such as creative writing and story planner formats. Lessons for...
PBS
Pbs Teachers: Escape! Because Accidents Happen: Car Crash
Examine the benefits and risks of using seat belts and analyze national statistics on seat belt use. Design and implement a study of local seat belt use and compare the results to the national statistics.
The Franklin Institute
Frankin Institute Online: Group Graphing
This site from The Franklin Institute explores how to make a simple graph using a spreadsheet to portray survey data. It also gives a set of interesting sports-related web sites so that students can get statistical inforamtion.
ABCya
Ab Cya: Fuzz Bugs Graphing
Students drag the fuzz bugs into the correct container to create a bar graph that is used to compare data.
TeacherLED
Teacher Led Interactive Whiteboard Resource Survey
Students can explore surveys, pie charts, and bar graphs with this interactive white board resource.
CK-12 Foundation
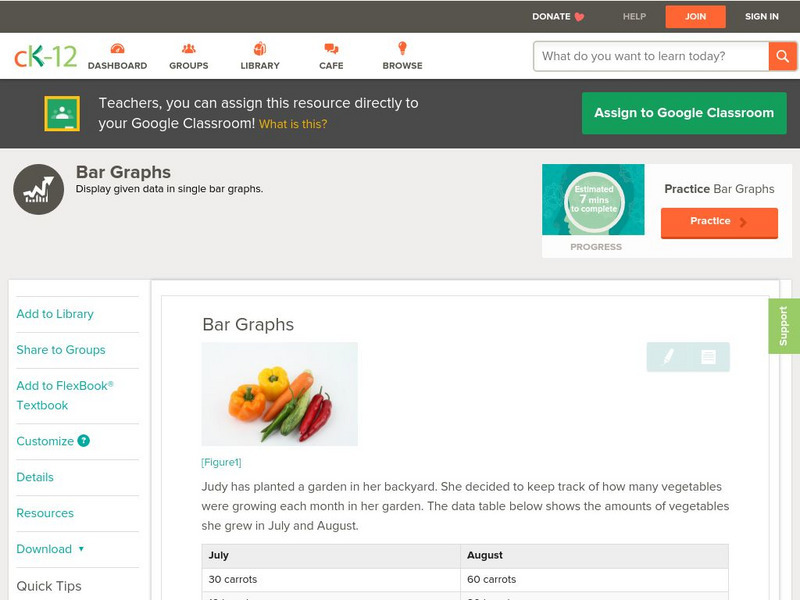
Ck 12: Statistics: Bar Graphs Grade 6
[Free Registration/Login may be required to access all resource tools.] Create a bar graph to display given data.
CK-12 Foundation
Ck 12: Statistics: Bar Graphs Grade 7
[Free Registration/Login may be required to access all resource tools.] Make a bar graph to display given data.
CK-12 Foundation
Ck 12: Statistics: Bar Graphs Grade 8
[Free Registration/Login may be required to access all resource tools.] Students will interpret data to understand given bar graphs.
CK-12 Foundation
Ck 12: Statistics: Bar Graphs Grades 9 10
[Free Registration/Login may be required to access all resource tools.] Make a bar graph to display given data.


