Curated OER
Graphing Review
in this graphing review worksheet, students solve a variety of problems such as interpreting parabolas, identifying intercepts and asymptotes, and identifying functions. They solve piecewise functions and rational functions. This twenty...
Curated OER
The Tale of the Feral - Care and Multiplication of Feral Cats
Students differentiate between a feral cat and a domesticated cat. In this cat lesson plan, students use the scientific method, calculate averages, solve story problems, and learn how a caretaker can help a feral colony live safely.
Curated OER
Campaign 2000
Students research newspapers and the Internet to learn about the election. Students work in groups and choose a state that they want to compare to Florida. Students organize the data they have found into a graph labeling an "x" and "y"...
Curated OER
Mean, Median, and Mode
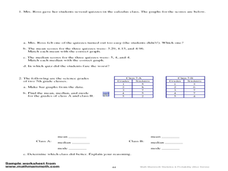
In this mean, median, and mode worksheet, students find the mean, median, and mode for 4 sets of numbers and answer short answer questions about them. Students answer 5 short answer questions.
Curated OER
Calculating Averages
In this calculating averages worksheet, students add four two-digit numbers in a column and divide to compute the average for 15 problems.
Curated OER
Averages
In this averages worksheet, students complete word problems where they find the average (sometimes called 'mean') of numbers. Students complete 10 multiple choice word problems.
Curated OER
Averages word problems
In this averages worksheet, learners solve word problems having to do with averages of numbers, money, and measurements. Students complete 10 word problems.
Curated OER
Mean, Mode and Bar Graphs
In this mean, mode and bar graphs instructional activity, 5th graders analyze the data given, then answer three questions about a bar graph and the data shown.
Curated OER
Radical Transformations
Students transform the square root function graphically. For this transforming the square root function graphically lesson, students use their Ti-Nspire to change the a, b, and c values of th square root graph. Students...
Curated OER
Using mean, median, and mode
In this mean, median, and mode activity, students read how to use each method and then complete problems using each one. Students complete 8 problems.
Curated OER
Chapter Books
In this line plot worksheet, students create a line plot of the chapter books read by the students of a class and find the median and mode. Students complete 3 tasks.
Curated OER
Box-and-Whisker Plots
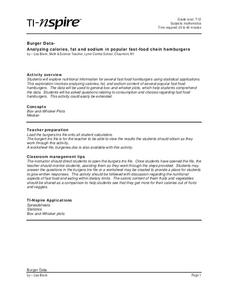
Students explore nutritional information for several fast food hamburgers using statistical applications. In this statistics lesson, students analyze calories, fat, and sodium content of various fast food restaurants. Students also...
Curated OER
Excel Turns Data Into Information
Students use excel to analyze data. In this technology activity, students enter data into the excel program to find averages and organize data.
Curated OER
Handling Data/Measures of Average - Finding the Mean from Displayed Data
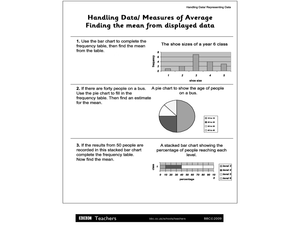
For this mean and average worksheet, students use the bars and charts to help them find the means using the given data. Students solve 3 problems.
Curated OER
Finding the Average Temperature
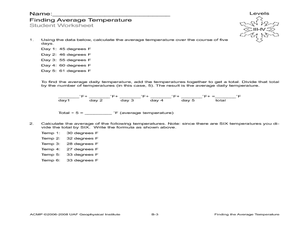
Students calculate averages. In this average temperature lesson, students collect data and use their problem solving skills to calculate average temperatures.
Curated OER
Finding Averages as Means
Students calculate the mean. In this activity on averages, students watch a video on athletes and averages and complete a worksheet. This activity emphasizes mean as the "fair share measure of center".
Curated OER
Describing Range and Measures of Central Tendency in Shoe Sizes
Students describe the range and various measures of central tendency using shoe sizes from a video. In this range and measures of central tendency lesson, students use the same data set to identify the concepts of range, mode, median,...
Curated OER
My Peanut Butter is Better Than Yours!
Students explore the concept of statistical data. In this statistical data instructional activity, students read an article about the dangers of peanut butter to those who are allergic. Students perform a taste test of two different...
Curated OER
Range and Mode
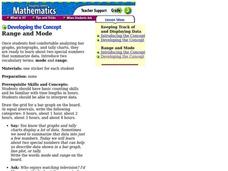
Fifth graders interpret data. In this mode and range lesson, 5th graders define mode and range and practice finding them given a set of data.
Curated OER
Away we Go
Young scholars work in groups to calculate the costs of a trip to Six Flags amusement park. In this domain and range instructional activity, students calculate the least and greatest amounts of money needed for tickets, food, souvenirs,...
Curated OER
Mean, Median and Mode
Fourth graders describe weather data using the mean, median and mode. In this mean, median and mode lesson, 4th graders understand how to calculate data using mean, median and mode and why they would use each one.
Curated OER
Range and Mode
Young scholars interpret data from graphs. In this range and mode lesson, students review a tally chart, pictograph and bar graph. Young scholars use these graphs to calculate the range and mode of each set of data.
Curated OER
Are Taxes "Normal?"
Learners explore the concept of normal distribution. In this normal distribution lesson, students find the normal distribution of taxes in the 50 US states. Learners make histograms, frequency tables, and find the mean and median of tax...
Curated OER
Box and Whisker Plots
Seventh graders explore the concept of box and whisker plots. In this box and whisker plots instructional activity, 7th graders plot data on a box and whisker plot. Students discuss the mean, median, and mode of the data. Students...

