Curated Video
Learning R for Data Visualization (Video 30)
R is on the rise and showing itself as a powerful option in many software development domains. At its core, R is a statistical programming language that provides impressive tools for data mining and analysis, creating high-level...
Curated Video
Comparing Box Plots: Analyzing Shape, Center, and Spread
This video explains how to interpret and compare box plots by analyzing shape, center, and spread. We review the five-number summary and how to determine the minimum, quartiles, median, and maximum. We also discuss the importance of...
Curated Video
Understanding Box Plots: When and Why to Use Them
This video explains when and why a box plot is an accurate representation of a given set of data. It discusses the structure of a box plot, including the 5 number summary, and demonstrates how to create one using math scores as an example.
Flipped Math
Comparing Distributions
Here's a lesson that is beyond compare. Young mathematicians learn to compare data distributions in the fourth of five installments in Algebra 1 Unit 4. They consider the shape of the distributions, identify any outliers, and compare the...
Flipped Math
Boxplots and Interquartile Range
Box in a lesson on box plots. Viewers of an informative video learn how to create box plots, both by hand and by using a graphing calculator. Additionally, they determine the interquartile range and interpret the value in terms of the...
Anywhere Math
Box-and-Whisker Plots
Whiskers are more than just a cat facial feature! Learn how the whiskers of a box-and-whisker help make conclusions about a data set. An instructor first explains how to create a box-and-whisker and then how to read it. Several examples...
Corbett Maths
Comparing Box Plots
Stacked box plots create an informative visual display. Using a video lesson, scholars compare data from box plots plotted on the same number line. They use both the visual display and the key intervals to make conclusions.
Corbett Maths
Drawing and Reading Box Plots
Box and whiskers have more to do with data than they do with cats! A video lesson describes how to plot, analyze, and compare box plots. Mathematicians first learn to create a box plot and then how to use information about the quartiles...
Khan Academy
Khan Academy: Algebra: Box and Whisker Plot
Video demonstrates how to create a box-and-whisker plot from a set of data. [13:14]
Texas Education Agency
Texas Gateway: Study Edge Statistics: Box Plots and Comparing Distributions
Explains the features of box plots and the statistical vocabulary that is used when describing them. Also models how to compare and contrast distributions. Includes downloadable study guide with exercises - guide also covers other...
Khan Academy
Khan Academy: Statistics: Box and Whisker Plots
Video demonstrating the creating of a box-and-whisker plot to analyze data. Includes link to practice problems. [10:05]
Sophia Learning
Sophia: Box and Whisker Plots
Box-and-whisker plots are explored in this tutorial. The lesson provides a PowerPoint presentation that defines the terms involved and a video lesson that demonstrates how to create a box-and-whisker plot.
Virtual Nerd
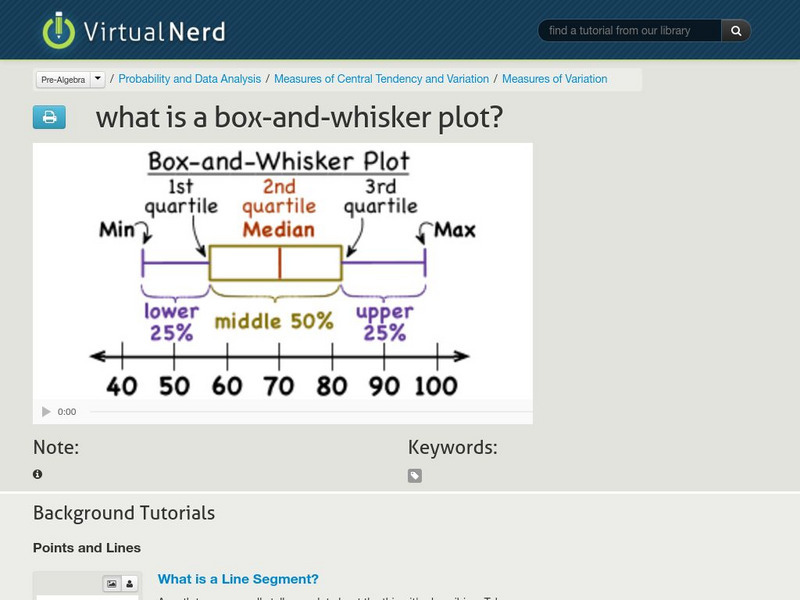
Virtual Nerd: What Is a Box and Whisker Plot?
View this video tutorial to learn about box-and-whisker plots. [5:36]
Khan Academy
Khan Academy: Statistics: Reading Box and Whisker Plots
Video demonstration of reading a box-and-whisker plot to find the range, median and quartiles and to answer a question. [3:18]
Loyola University Chicago
Math Flix: Graphs: Box and Whisker Plots
This video provides an opportunity to create a Box and Whisker Plot. A pdf worksheet is available by clicking on the hyperlink at the bottom of the page. As you watch and listen to the teacher and student interact it helps clarify the...
Sophia Learning
Sophia: Creating a Number Line for a Box Plot: Lesson 2
In this video lesson [3:35], students see how to construct the number line for a box plot. This is part of a series of lessons about construction of parts of a box plot. It is 2 of 9 in the series titled "Creating a Number Line for a Box...
Sophia Learning
Sophia: Creating a Number Line for a Box Plot: Lesson 5
In this video lesson [2:45], students see how to construct the number line for a box plot. This is part of a series of lessons about construction of parts of a box plot. It is 5 of 9 in the series titled "Creating a Number Line for a Box...
Sophia Learning
Sophia: Finding Data on a Box Plot: Lesson 6
In this lesson, students see how to extract specific information from a box plot. Students should be able to read a box plot before beginning this lesson. It is 6 of 6 in the series titled "Finding Data on a Box Plot."
Sophia Learning
Sophia: Finding Data on a Box Plot: Lesson 1
In this lesson, students see how to extract specific information from a box plot. Students should be able to read a box plot before beginning this lesson. It is 1 of 6 in the series titled "Finding Data on a Box Plot."
Sophia Learning
Sophia: Whiskers of a Box Plot: Lesson 5
This lesson discusses the whiskers of a box plot and what they represent about the data. This is part of a series of lessons about parts of a box plot. It is 5 of 5 in the series titled "Whiskers of a Box Plot."
Sophia Learning
Sophia: Creating a Number Line for a Box Plot
In this video lesson, students see how to construct the number line for a box plot. This is part of a series of lessons about construction of parts of a box plot.
Sophia Learning
Sophia: Creating a Number Line for a Box Plot
In this video lesson, students see how to construct the number line for a box plot. This is part of a series of lessons about construction of parts of a box plot.
Sophia Learning
Sophia: Whiskers of a Box Plot: Lesson 2
This lesson discusses the whiskers of a box plot and what they represent about the data. This is part of a series of lessons about parts of a box plot. It is 2 of 5 in the series titled "Whiskers of a Box Plot."


