Curated OER
Water Fun
Students examine uses for water. In this water lesson plan, students discuss how they use water. As a class students make a PowerPoint by naming one swimming safety rule. Students compare and contrast fishing for fun and fishing for...
Curated OER
Making and Describing Shapes
Explore the concept of creating and describing 2D and 3D shapes. Using geometry your scholars will describe the attributes of shapes and their properties. They explore and discover what happens when you combine shapes and then take...
Curated OER
WHAT IS THE POPULAR COLOR?
Fourth graders graph cars according to their colors. They complete the graph including a title, scale, x-axis, and y-axis. Students collect the data and choose the type of graph to be made.
Curated OER
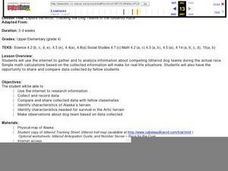
Explore the Arctic: Tracking the Dog Teams in the Ididarod Race
Fourth graders use the Internet to gather and analyze information about competing Iditarod teams during the actual race. They also have the opportunity to share and compare data collected by fellow students.
Curated OER
PASS the Arts
Students explore math and art concepts, create digital art examples of the concepts, and incorporate these works into a PowerPoint portfolio with explanation and analysis.
Curated OER
Teaching in the Shared Way of Ghandi and Montessori
In this differentiated lesson, learners incorporate different subjects using the Ghandi and Montessori methods instead of the traditional method used in regular schools. In math they investigate shapes, colors and sizes. In writing they...
Curated OER
Deena's Lucky Penny
Learners discover the coin denominations of U.S. Currency. In this money lesson, students read the book Deena's Lucky Penny, then complete a coin matching activity using the Internet. Learners also read Shel Silverstein's poem...
Curated OER
Cooking Cranberry Pudding
Students explore colonial cooking. In this cross curriculum George Washington and colonial America history activity, students follow a recipe for cranberry pudding, a possible favorite of George and Martha Washington. Students measure...
Curated OER
Excel temperature Graphs
Students gather data about the weather in Nome, Alaska. In this Nome Temperature lesson, students create an excel graph to explore the weather trends in Nome. Students will find the average weather and add a trend line to their graph.
Curated OER
One, Two, Three...and They're Off
Students make origami frogs to race. After the race they measure the distance raced, collect the data, enter it into a chart. They then find the mean, median, and mode of the data. Next, students enter this data into Excel at which time...
Alabama Learning Exchange
The Grouchy Ladybug
Learners listen to the book, "The Grouchy Ladybug" by Eric Carle and sequence the events in the story. Using a graph, they draw and color the animals that the ladybug meets next to the corresponding time from the story, and conduct...
Curated OER
Where Do I Fit on the Graph?
Students collect data and create graphs about themselves, their community, and the world around them. They use a variety of methods to organize data, such as stickers, clothespins, name tags, coloring, tally marks, etc.
Curated OER
Polluting the Environment
Fourth graders construct mini-ecosystem, pollute the ecosystem, observe, collect, and record data on the effects of these pollutants on their ecosystem, organize data on spreadsheets, create graphs, and design presentations to share with...
Curated OER
The Blues . Music Education
What ultimately influences a musician's creations? Is it the time in which he/she lives, his/her personal experiences, the music of the time and previous times, or the image the artist hopes to convey? This lesson explores these...
Curated OER
Yummy Apples!
Learners discuss apples and how they are grown. They listen as the teacher reads "Apples," by Gail Gibbons. Students discuss the story. They view several different types of apples and compare their characteristics. Learners taste several...
Curated OER
Calendar Communication
Students identify days, dates, and month on a calendar. In this calendar instructional activity, students use a blank calendar page and fill in the days of the month. Students recall what they learned on specific days and record that...
Curated OER
Off We Go
First graders identify different types of transportation, and explain why each is important. They pretend they are going on a trip. They choose their mode of transportation, and use play money to buy their tickets.
Curated OER
Getting A Grip On Graphs
Fourth graders investigate the concept of graphing and comparing different types of data using pictographs, line graphs, scatter plots, etc... They gather data and make interpretations while examining the medium of how it is displayed.
Curated OER
Getting A Grip On Graphs
Fourth graders gather variety of data and create a graphs to display the data.
Curated OER
What's Your Line?
Fifth graders collect temperature readings over a period of time, enter the information into a spreadsheet and choose the appropriate graph to display the results.
Curated OER
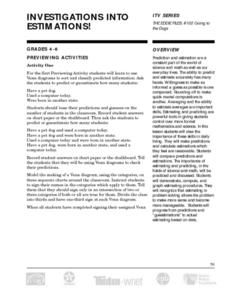
Investigations into Estimations
Learners gain the powerful tools of estimation, prediction, and averaging and discover the importance these tools have in daily living.
Curated OER
Mathematical Magazines
Students classify and tabulate the type of advertisements found in a collection of magazines. Determination is made on what percent of the total number of ads each type represents. They present their results orally and in a graph.
Curated OER
Mathematics Within: Bar And Pie Graphs
Young scholars compare and contrast the use of bar and pie graphs with the same data. They create a data set by surveying all students in the class using sticky notes to make a table on the board. Then, each student creates a bar and pie...
Curated OER
A Relatively Far Out Idea: Estimating
Students investigate methods of estimating through cooperative group activities, hands-on activities, the use of tables and graphs and an interactive video.
Other popular searches
- Venn Diagram Math Worksheets
- Math + Venn Diagram
- Math Venn Diagrams
- Graphing Math Venn Diagrams
- Sorting Math Venn Diagrams
- Math Venn Diagrams Shape
- Venn Diagrams Math Fractions
- Sets Venn Diagrams Math
- Venn Diagram Math Drawing
- Math Venn Diagram Ms
- Math Venn Diagrams Worksheet
- Venn Diagram Math College


