Curated OER
Seeing Life Through An Artist's Eyes
Students examine how art can change the way they look at their lives. After being read a book, they discuss the importance of art in their world and what would happen if it were taken away. They create a watercolor painting and shares...
Curated OER
Our Daily Five
Students explore the food pyramid through a class discussion, hands-on experience with food items, and a floor game that helps them to identify the food group involved. Lesson extensions include the use of play money, art, and dance.
Curated OER
Instructional Software Resources for Grades K-3
Young scholars become familiar with teh selection, evaluation, and use of instructional software for 4-8 classroom. They download software demos from the web and discuss critiquing software. Students browse software evaluations on web...
E-learning for Kids
E Learning for Kids: Math: Elephant Plant: Data
Gyan's family grows flowers. Can you help him interpret displayed data about their plants?
Khan Academy
Khan Academy: Solve Problems With Bar Graphs 1
Read and interpret bar graphs. Students receive immediate feedback and have the opportunity to try questions repeatedly, watch a video or receive hints.
Illustrative Mathematics
Illustrative Mathematics: Weather Graph Data
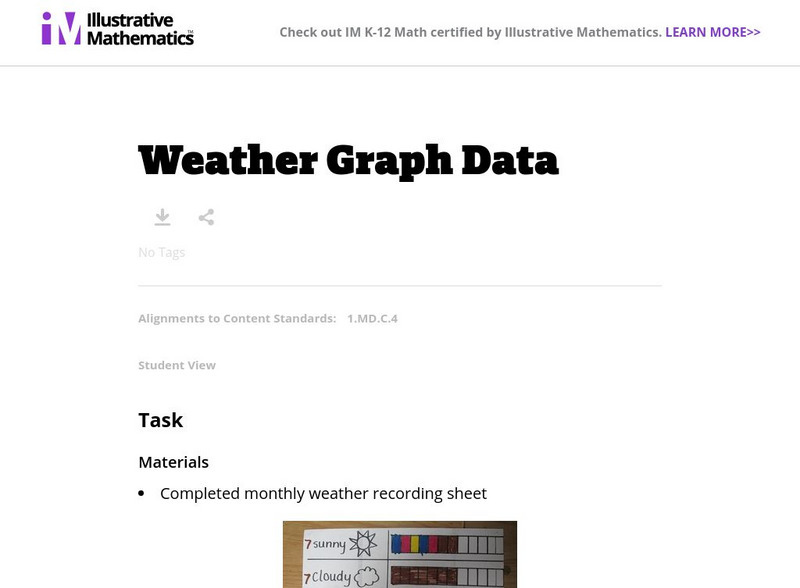
The purpose of this task is for students to represent and interpret weather data, as well as answer questions about the data they have recorded. Student worksheets and recording sheet are included.
Khan Academy
Khan Academy: Solve Problems With Picture Graphs 1
Read and interpret picture graphs. Students receive immediate feedback and have the opportunity to try questions repeatedly, watch a tutorial video, or receive hints.
E-learning for Kids
E Learning for Kids: Math: Orange Trees, Olive Trees: Data and Capacity
In this lesson, students collect data related to a question, compare and order the capacity of containers, and interpret picture graphs.
Education Place
Houghton Mifflin: Eduplace: Make a Living Bar Graph
Student use simple data to line up in a living bar graph activity when they respond to simple questions in this lesson plan. They physically and visually represent the data. CCSS.Math.Content.3.MD.B.3 Draw a scaled picture graph and a...
ClassFlow
Class Flow: Interpreting Tables and Graphs
[Free Registration/Login Required] Explore a variety of graphs and tables. Many activities are incorporated to provide practice solving problems using different graphs and charts.
ClassFlow
Class Flow: Kindergarten Graphing
[Free Registration/Login Required] This math flipchart teaches kindergarteners how to place an object/picture on graph and how to interpret the results.
