Curated OER
Number Pairs
This engaging coordinate pairs activity will have scholars intrigued; they mark 13 points on a grid and then connect them to create a capital block letter. Which one will it be? The grid has whole numbers 0-10 along both axes, so...
Curated OER
Location on a Grid
Locating a point on a grid is an important skill to master; use this practice sheet to give schlars some clear and useful experience. On a large, simple grid they use a coordinate system to find specific squares and color them a given...
Curated OER
Number Pairs
As you introduce graphs to young scholars, use this coordinate pairs activity to give them some independent practice. Learners examine 12 points on a graph, all of which are in the first quadrant (and therefore positive). They write the...
Curated OER
Graphs
For beginners to picture graphs this is the perfect resource. They analyze two bar graphs that break down data visually so scholars can actually count the number in each column. For the first, they fill in how many of each type of pet is...
Curated OER
Graphs that Represent Data Sets
These four scenarios all contain graphable data; can scholars match them to the correct bar graphs? All the data is in single-digit whole numbers. Some of the scenarios instruct kids to make a graph, while others don't. Clarify...
Curated OER
Shape Picture
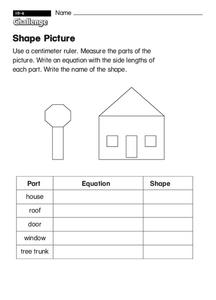
Get your youngsters using rules! For this challenge, they measure the shapes that make up a house and a tree to practice measuring in centimeters. Then, they write down the equation for each shape. (Example: 4+6+4+6.) Finally, they...
Curated OER
Easter Graphing Fun
Graphing can be festive! This Easter worksheet has scholars using coordinates to record the location of ten holiday images. The first is done for them, and the grid is large and appealing to younger learners. Consider visualizing this...
Mathwire
Shape Investigation: Area and Perimeter
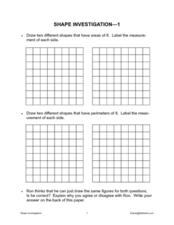
Does a shape's perimeter always match its area? Learners approach this and other claims in this shape investigation worksheet. Using blank grids, they draw various shapes based on required perimeter and area measurements, labelling the...
Curated OER
Mental Math Problems
In this sequencing worksheet, students make a number sequence chart by following the given rule, continue number sequences through seven additional numbers, and continue patterns. Students solve five multiple answer problems.
Curated OER
A Day at the Beach
Let's go to the beach! Danielle, Marty, and Phil collected shells at the beach. Can you determine how many shells each child has? Create a picture graph to make the data easier to understand.
Curated OER
Where Did the Bunny Leave the Eggs? Picture Graphing Activity
The Easter Bunny left us a bunch of eggs, but how many did he leave? Learners use the data to create a picture graph, interpret it, and answer the questions that follow. There's even easy egg cut-outs for your youngsters!
Curated OER
Graphs: Students in Math Classes
Are your second and third graders just beginning to read bar graphs? This graph looks at the number of learners present in a math class Monday-Friday. Learners look for basic information, and the graph is easy to read.
Curated OER
Count the Images!
Based on a selection of images, learners create a bar graph depicting how many of each image is shown. There are two graphs, each with three images to chart. After they are finished, scholars can analyze the data and draw conclusions. To...
Curated OER
Make a Table
First and second graders participate in an experiment then create a table of tally marks to identify the totals. They problem solve, tally twenty experiences, and generate an answer to one question.
Curated OER
Place Value (d4)
In this identifying place values worksheet, students fill in a chart of three digit place numbers and read numbers and fill in the blanks indicating their place values. Students write twelve answers.
Curated OER
Graph Picture (Coordinate Pairs) 3
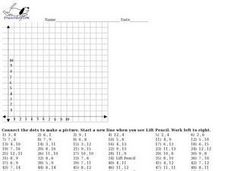
Here is a very good coordinate graphing instructional activity. Learners practice graphing by plotting 58 coordinate pairs, then connecting the dots to reveal a picture. This resource could be used as an in-class activity or a homework...
Curated OER
Graph Picture (Coordinate Pairs) 2
Looking for an engaging way to encourage your class to practice graphing coordinate pairs? This might be the activity you are looking for! For this worksheet, learners create a picture by plotting 54 coordinate pairs on graph and then...
Curated OER
Graph Picture (Coordinate Pairs)
Coordinate graphing on a grid is the focus of this worksheet. Young mathematicians plot 42 coordinate pairs on a graphing grid, then connect the dots to make a picture. A fun way to get your learners involved in graphing!
Curated OER
Reinforcement: Point/Sticker Cards
I love these! Print, cut, and laminate any of these sticker cards to help you manage classroom behavior in a positive way. Tape the blank chart on your learner's desk,or reward him by giving a point or sticker in each of the squares....
Curated OER
Using Grams and Kilograms
Practice the metric system with this basic worksheet. Guided by a fun illustration of a mouse, learners problem solve using a balance scale. Two graphic organizers allow them to record their findings in grams and kilograms.
Curated OER
Napier Rods
Napier Rods were created by John Napier, and are used to help with multiplication problems. The chart is very similar to a typical multiplication chart but has a unique history that learners may find interesting.
Curated OER
Graphs to Represent a Data Set
How many animals did Chaplin see at the zoo? Scholars examine three data sets and create a bar graph for each. Encourage them to label the different parts of their graphs, as this is not prompted on the worksheet. Once they finish their...
Curated OER
Measuring Time in Minutes
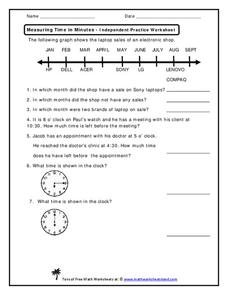
Time is measured in both months and minutes; scholars first examine a line graph to see in which months an electronic shop had sales on specific laptop brands. They answer three questions about the data. Then, they determine how much...
Curated OER
Graphs to Represent a Data Set
By analyzing a word problem about hours worked in a week, scholars get valuable practice with bar graphs and data analysis. They read the scenario, then examine a table of data taken from it. The data includes four days and the...


