Alabama Learning Exchange
Jelly Beans Add Up
Students explore counting, sorting, and graphing skills. For this data analysis lesson, students sort jelly beans by color, count the jelly beans, and create a bar graph of the jelly beans according to color.
Curated OER
Jelly Belly: What a Wonderful "Bean"!
Young scholars explore how jelly beans are produced. They discuss the origins of the jelly bean and view a video about how jelly beans are prepared, tested, shaped, finished, and shipped and estimate the amount of jelly beans in a jar...
Curated OER
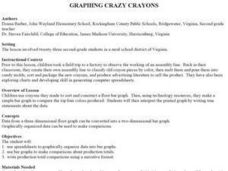
Graphing Grazy Crayons
Children create crazy crayons they made to sort and construct a floor bar graph. Then, using technology resources, they make a simple bar graph to compare the top four colors produced. Students will then interpret the printed graph by...
Curated OER
Tally Time
Students create a tally chart. In this math and health lesson plan, students discuss healthy foods and create a tally chart showing the number of students who like to eat healthy foods.
Curated OER
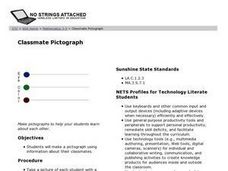
Classmate Pictograph
Students create pictographs using their classmates in this technology-based lesson. The lesson uses Inspiration, or Kidspiration, digital cameras, and a downloadable pictograph template.
Curated OER
An Apple A Day
Students create a graph that showcases their pick for favorite kind of apple. Students are given samples of a variety of apples to determine their favorite in a taste test. They a create a tally chart of favorite kinds apples and use a...
Curated OER
Jack and the Beanstalk Math
Students listen to Jack and the Beanstalk and determine what they think are the most common words. In this Jack and the Beanstalk lesson, students reread the story, count the words they chosen and graph those words. Students graph the...
Curated OER
Thank You... Thomas Edison!
Pupils investigate the life of Thomas Edison. They research how he made a difference. They understand that accurate data collection is important for math. They create a chart using spreadsheet data.
Curated OER
Data Analysis and Probability Race to the Finish
Students practice addition facts, record data, and construct a bar graph. For this probability lesson, students participate in a board game in which bicycles move towards a finish line based on players completing addition problems. Dice...
Curated OER
Food Pyramid Power: Looking Back and Moving Forward
Students show their knowledge of properties of objects as it pertains to sorting and creating patterns. In this food pyramid power lesson, students show their ability to use whole numbers in different representations by appling...
Utah LessonPlans
Seed Sort
Students form a variety of categories for seed mixes (wild bird seed or 15 bean soup) and create graphs to display their categories.
Curated OER
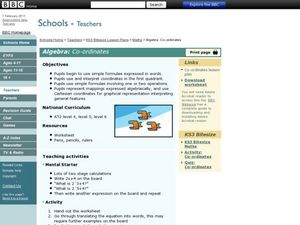
Algebra: Co-ordinates
Students use Cartesian coordinates. In this graphing instructional activity students use simple formulae, interpret coordinates, and create graphical representations. They express their work algebraically.
Curated OER
The Stock Exchange Phase I
Second graders select a stock and follow its ups and downs, using graphs to show its success.
Curated OER
What's Your Favorite Stuffed Animal?
Second graders gather information in a survey and interpret the results using a tally chart, a table, and a bar graph. They' present their results of the during the final group discussion. The subject of the survey is favorite stuffed...
Curated OER
Survey and Share
Young scholars practice collecting data by surveying other students. In this data collection lesson plan, young scholars decide on a question and collects data from 15 other students. Eventually the young scholars will end up graphing...
Curated OER
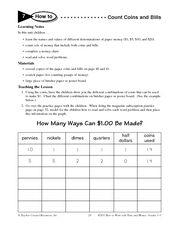
How To: Count Coins and Bills
Students discover the names and values of different monetary denominations. In this money lesson, students examine the different combinations that money can be added in to find specified amounts. The students complete worksheets based on...
Curated OER
Penguin Heights
Students use the worksheet from the first website listed below to collect data on the penguin heights on the Penguin Page.
Curated OER
Halloween Candy Sort
Students use their Halloween candy to practice sorting and classifying. They compete a Venn diagram comparing their candy wrappers. They develop ways as a class to catorgize the candy in different ways.
Curated OER
Story Problem Writing
Students write story problems which can only be solved with the application of multiplication facts. They write an extra fact that isn't needed to solve. When their partners do the problems, they must cross out the fact that they do need.
Curated OER
Which Tape is Stickiest?
Students conduct an experiment to determine which style of tape will stick the best. In this controlled experiment lesson plan, students predict which tape will stick best to a marble that rolls over it, then they conduct the experiment...


