Curated OER
Make a Table
First and second graders participate in an experiment then create a table of tally marks to identify the totals. They problem solve, tally twenty experiences, and generate an answer to one question.
Curated OER
Reinforcement: Point/Sticker Cards
I love these! Print, cut, and laminate any of these sticker cards to help you manage classroom behavior in a positive way. Tape the blank chart on your learner's desk,or reward him by giving a point or sticker in each of the squares....
Curated OER
Using Grams and Kilograms
Practice the metric system with this basic worksheet. Guided by a fun illustration of a mouse, learners problem solve using a balance scale. Two graphic organizers allow them to record their findings in grams and kilograms.
Curated OER
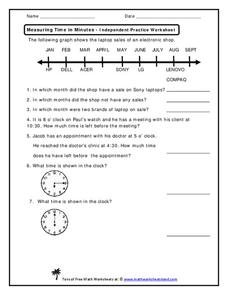
Measuring Time in Minutes
Time is measured in both months and minutes; scholars first examine a line graph to see in which months an electronic shop had sales on specific laptop brands. They answer three questions about the data. Then, they determine how much...
Curated OER
Graphs to Represent a Data Set
Here are a some pre-made sets of data that kids can use to practice data analysis. There are 10 survey scenarios written out, and scholars synthesize the results of each into a bar graph. In addition to the graphing, they answer two...
Curated OER
Generate Measurement Data Word Problems
Plot data for three word problems, each with a table of data. Learners create line plots for these, all of which have only single-digit whole numbers. The large text and few number of problems make this ideal as a whole-class warm up....
Curated OER
Graphs to Represent a Data Set
As your scholars begin to learn how to read graphs, help them pay attention to detail with this matching activity. They read four short data descriptions and match them to one of the four bar graphs pictured. Each graph is labeled along...
Curated OER
Graphs to Represent a Data Set
Here are Jack's hours for the week; scholars organize them into a bar graph in this data analysis learning exercise. They write the days along the y-axis and hours along the x-axis. Encourage labeling for this. Consider projecting as an...
Curated OER
Generate Measurement Data Word Problems
Using a set of simple data, learners create a line plot to organize the information. This data includes only single-digit numbers and the highest number is six. Because the answer is explained and illustrated at the bottom, project this...
Curated OER
Generate Measurement Data Word Problems
Beginning graphers will appreciate this practice with basic bar graphs. For each table of data, there is a corresponding graph for learners to match it to. The five data sets all have the same two factors: days and numbers. Although this...
Curated OER
Generate Measurement Data Word Problems
Bar and line graphs are an excellent way to visually analyze data: give your scholars practice both analyzing graphs and creating their own! First, they examine five basic bar graphs, indicating the number of squares on specific days....
Curated OER
Calculate the Area of Shaded Squares
How can you find the area of a shape? Two shapes are provided on this simple worksheet which asks learners to find the area of the shapes. It's not as hard as it looks! You just have to count the squares! Before telling your pupils this...
Curated OER
Teaching Ideas and Resources
In this teacher website, teachers have access to a variety of tools and resources. Teachers can utilize plans, lessons, and worksheets in all subject areas.
Curated OER
Use a Graph
Information is often presented in graph form. Can your youngsters read a basic bar or picture graph? Six word problems accompany three graphs. One graph is a bar graph and the other two are pictographs.
Curated OER
All Kinds of Hats Graphing Fun
Where are the hats located? A graphing activity has mathematicians finding coordinates to give exact locations of ten hats scattered on a grid. An example is done for them. Consider showing learners this skill by putting hats around the...
Curated OER
Make Your Own
Your first and second graders will categorize hearts, triangles, and stars, putting them in a picture graph. After the shapes are organized, they compare the number of each using the sentence frames provided.
Curated OER
Picture Graphs
Are your youngsters learning how to read picture graphs? Use these five examples to asess your learners' comprehension. Consider rearranging them differently; the presentation is slightly congested.
Curated OER
Read a Picture Graph
It's the Bears vs. the Seals! Who is the season winner? Read this data and have your math class answer the six questions that follow. Consider graphing the chart as a class, or encouraging individuals to graph it before answering the...
Curated OER
Math--Pictures and Bars--Learning About Graphs
What is a graph? What does it tell us? How do you make one? These are all questions that are answered in the included packet. It's a great introduction to graphing for young learners!
Curated OER
Tim and Pat at the Store: Bar Graphs
Do you like candy? Tim and Pat go to the candy store every day after school. Can you use the chart to determine how much money they spend each day? Does one spend more than the other?
Curated OER
Graphing Toys!
Jason, Michelle, Sofia, and Willis all have a variety of toys. Use the chart provided to graph how many toys each child has. Who has the most toys? Who has the least? Help your learners study the graphs they create to better understand...
Curated OER
Confusing Fractions and Decimals
Eight number lines are given, and math scholars need to place the given decimal numbers on the fraction line as accurately as possible. Each number line shows a different span of numbers. Consider having learners go through it the first...
Curated OER
Frequency Tables - Home Link Support
In this home school support worksheet, 2nd graders, with a home support person, review the use of frequency tables to organize and display data. They make their own frequency table and read it with the support person.
Curated OER
The Five Food Groups
In this five food groups worksheet, students look over a chart containing the five food groups and the seven days of week and color the group they eat each day.


