Curated OER
Canada at a Glance
Stjudents examine the statistics in a Canadian publication for use in graphs. They develop their own questions based on tables and graphs found in this publication..
Curated OER
Graphs: All About Our Class
Students respond to survey questions, discuss results, brainstorm ways to represent survey information, and create table of class results. They find mean, range, and percentages, and create graph to display results.
Curated OER
How Much Do I Watch TV?
In this television watching worksheet, students determine the amount of television they watch in a week by recording the names and times of the shows. They total the number of hours of watching time. You can use this with upper...
Curated OER
Mean, Median, Mode, and Range - Homework 14.3
For this data and statistics worksheet, students find the mean, median, mode, and range of 4 different sets of data. Next, students solve 1 word problem where they find the mean.
Curated OER
Fall Leaves
For this fall leaves worksheet, students identify the colors of leaves and determine the number they have of each. This worksheet may be used in elementary grades, for color identification and counting purposes. For the middle school...
Curated OER
Survey: What Shape Has More In the Lucky Charms Box?
In this Lucky Charms activity, students identify the shapes in the box, and using tally marks, count how many of each shape are included. This activity may be used in elementary grades, for counting and tally purposes, but it also can be...
Curated OER
Statistics and Shopping
Explore how statistics are used in everyday life. Your soon-to-be savvy consumers use the Internet to find consumer-related statistical information and learn to make wise consumer decisions. Includes links to a practice sheet about data...
Curated OER
Digital Statistics
Research data analysis by creating charts in class. Define the differences between an "average" and "range" while examining measurement data based on student height. Utilize computer software to create a height graph which is shared with...
Curated OER
Calculating Probabilities: Introduction
Introduce your class to a sure-fire method for calculating probabilities. The method is described alongside several examples, then put into practice with a series of probability questions for the class to solve. This would be a great...
Curated OER
Candy Bar Measurements
Geometers explore mathematics by completing an object measurement worksheet. They utilize a variety of candy bars and rulers to conduct a measurement experiment in class. They complete worksheets as a group based on the measurement...
Curated OER
Quiz: Reading and Making Line Plots
In this reading and making line plots instructional activity, students create a line plot for given sets of numbers. In addition, they read graphs and interpret the average. This one-page instructional activity contains ten problems.
Curated OER
Games for Probability: In-Class and Powerball Simulation
Your soon-to-be statisticians play a game to understand the difference between independent and dependent experiments and probability. They draw colored cubes from a bag and then, by either replacing the cube in the bag, or not, for each...
National Security Agency
Sampling for a Rock Concert
Over the course of three class periods, middle schoolers design an experiment to provide learner input to administration about which rock band to invite to play at school. They practice several random sampling exercises, all well...
Education World
High, Low, or In Between?
Trios play a card game that reinforces the concepts of number sequence and greater than and less than. Scholars make predictions based on information they know and a single unknown. They see cards drawn by others in the group, but not...
Curated OER
Water Cycle
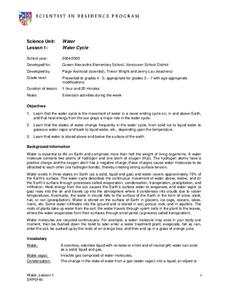
Young scientists explore Earth elements by conducting an experiment. They define water vocabulary terms such as condensation and precipitation. In addition, they conduct a water experiment in which they build a terrarium, so they can...
Curated OER
Re-Presenting Race in the Digital Age
Teen-aged scientists analyze a graphic organizer of how trash is removed from New York City and then answer standard questions about a graph and a diagram. Resources are mentioned, but there are no links to these resources, so you will...
Curated OER
Favorite Vegetable Survey
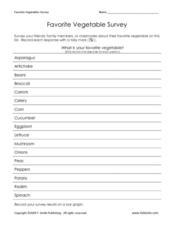
What's your favorite? Use this chart template in your lesson on data collection and graphing. Learners record classmates' favorite vegetable in a survey, and then graph the results. A labelled graph is provided here- print both pages...
Curated OER
Principles of Flight: Flying Paper Airplanes
Students investigate ways to enhance an object's flying ability. In this model construction lesson, students construct two paper airplanes, one of which is twice as big as the first. Students compare and contrast the two separate...
Curated OER
Tuberculosis Project
Reasearch the transmission of tuberculosis and design a communication product to help youth understand the risks of the disease, how it is tested for, and the benefits of proper treatment. This project incorporates language arts, math,...
Curated OER
Picture Graphs
Are your youngsters learning how to read picture graphs? Use these five examples to asess your learners' comprehension. Consider rearranging them differently; the presentation is slightly congested.
Curated OER
Interpreting Data from Birdfeeders
What kinds of birds live in your area? Read a book about birds to your learners and explore their feeding patterns. Charts and graphs are provided in this three page packet, but consider assigning the basic questions if using with young...
Curated OER
One Hundred Things
Learners practice estimating by handling items in groups of ten. They visualize how much space 100 items, such as pennies, peas, or beans, will take up after holding 10 of them. Students measure the difference in volume between 10 and...
Curated OER
iPod Songs - Bar Graph
In this graphing worksheet, 3rd graders examine a chart that shows the number and types of songs a child has loaded on her iPod. They total the number of songs, tell which type of song she has the most of, and make a bar graph of the...
Curated OER
Conditional Probability and Probability of Simultaneous Events
Students explore the concept of conditional probability and probability of simultaneous events. For this conditional probability and probability of simultaneous events lesson, students roll dice or use and applet to roll dice to...


