Curated OER
Measures of Central Tendencies: Quartiles
In this statistics activity, students calculate the mean, median, mode, range, lower quartile, and upper quartile for 10 questions and interpret a box and whiskers graph.
Curated OER
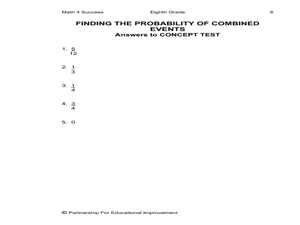
Finding the Probability of Combined Events
Eighth graders investigate the probability of combined events. In this eight grade probability lesson, 8th graders use a sample space, two events, and their intersections to determine the probability of each event, their intersection,...
Curated OER
Mr. P's Party Problem
In this party problem worksheet, students determine the number of handshakes that may be exchanged at a party. This one-page worksheet contains 1 combination problem. The answer is provided at the bottom of the page.
Curated OER
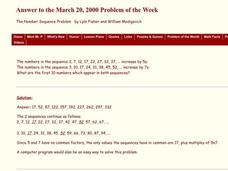
The Number Sequence Problem
In this number sequence worksheet, students identify the next number in a sequence. This one-page worksheet contains 1 problem. The answer is provided at the bottom of the page.
Curated OER
The Jelly Bean Problem
For this probability worksheet, learners solve 1 word problem about the probability of drawing a particular color jelly bean out of a bag. Students are given two bags with 4 jelly beans each.
Curated OER
Data Handling
For this data handling worksheet, students explore multiple ways to represent data. They create stem and leaf plots, histograms, and bar charts. Students examine and interpret diagrams and statistics. This eleven-page worksheet...
Curated OER
Geometric Progressions
In this geometric progression worksheet, learners examine a sequence and determine the next number. This one-page worksheet contains 15 problems.
Curated OER
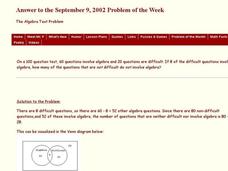
The Algebra Test Problem
In this algebra test worksheet, students construct and interpret a Venn Diagram. They determine the type of algebra problems designated in the Venn Diagram. This one-page worksheet contains 1 problem. The answer is provided at the...
Curated OER
Frequency Histograms, Bar Graphs and Tables #3
In this frequency histograms worksheet, students examine bar graphs, histograms and tables. They identify the model of information that best matches the statistics. This three-page worksheet cotnains two multiple-choice problems. ...
Curated OER
Discovering Magnets and Graphs
Sixth graders investigate averages and statistics by discovering magnet strengths. In this magnet experiment lesson, 6th graders utilize different magnets and attempt to attract different materials to them. Students record the...
Curated OER
Taste the Rainbow
Students practice estimating and graphing by utilizing Skittles. In this statistics instructional activity, students complete worksheets based on the likelihood of a certain color of skittle coming out of the bag. Students create a...
Curated OER
Technology Lesson Activity: Fractions
Fifth graders practice using the English measuring system by creating fractions. In this parts of a whole lesson, 5th graders combine math key bars to simulate small parts of a bigger item. Students combine the pieces to create...
Curated OER
Altering a Plant Environment
Students investigate what a controlled group is by creating an experiment. In this plant growth lesson, students identify the different parts of a plant and discuss what is needed for a plant to be successfully grown. Students grow a...
Curated OER
Radiation Reassessed
Students investigate the dangers of radiation by exploring recent nuclear tragedies. In this scientific debate instructional activity, students define the idea of radiation "half life" and determine if low doses of radiation are truly...
Curated OER
Weathervanes in the Wind
Students investigate wind and weather by creating a weathervane. In this environment instructional activity, students identify the purpose of a weathervane and observe weathervanes in action on their campus. Students create a...
Institute of Electrical and Electronics Engineers
Pollution Patrol
Students design and build an outdoor air pollution detector, test their designs, and communicate their results. In this investigative instructional activity students work in teams to design their detectors and use everyday items to do...
Curated OER
Electricity for Kids! It's Shocking!
Students investigate the world of electricity by completing a KWL sheet. In this energy instructional activity, students view PowerPoint presentations about electricity, who invented it, and how it is used today. Students define several...
Curated OER
Data Analysis
In this data analysis worksheet, students solve and complete 4 different types of problems. First, they reduce the data provided to find the means, and graph the means in a line graph. Then, students graph the data from each mixture...
Curated OER
Importance of Estimation
Young scholars discover the ability to estimate based on viewing photographs of objects. In this number sense lesson, students view photographs of numerous objects in which they must train their eyes to create an educated guess of how...
Curated OER
Time for All Ages
Fourth graders discover time keeping by analyzing technological advances in history. In this time lesson, 4th graders create and complete a KWL chart based on their research of a famous timekeeping invention, such as a sundial....
Curated OER
Making Data Meaningful
In this sample mean activity, students explore different ways "average" is used. Students use this information to find the sample mean of the height of a large class of students. Students find the mean, median, mode and range of two sets...
Curated OER
Unit 5 Probability
In this probability instructional activity, students determine the probability or possible outcomes for 40 problems.
Curated OER
Numbers in the News
Students examine numbers used in the real world by reading newspapers. In this number identification lesson, students explore popular newspapers and attempt to find numbers in prices, temperatures, dates, sports scores, etc. Students...
Curated OER
Taste Test
Third graders practice creating bar graphs by conducting a taste test. In this graphing lesson, 3rd graders taste several different brands of peanut butter and discuss among their classmates which tastes better. Students create a bar...


