Curated OER
Quarter, Nickel, Dime....
An engaging game called, "Quarter, Nickel, and Dime" is presented in this math lesson. Players are given an envelope with slips of paper that represent the three coins. In pairs, they play the game 18 times, and the whole class charts...
University of Arizona
Skittles & M&Ms Probability Experiment
Students are introduced to the scientific method by hypothesizing, counting, analyzing and concluding which company packs candy more reliably - Skittles or M&Ms.
Curated OER
Data Analysis Using Technology
Analyze data using technology. Middle schoolers design data investigations, describe data, and draw their own conclusions. Then they select the best type of graph, graph and interpret the data, and look for patterns in trends. They also...
Curated OER
Chances Are-Part 1
Students are introduced to the idea of probability by discussing the likelihood of events occurring. Pupils describe events that are certain, impossible, likely, and unlikely to occur. They determine the likelihood of an event occurring...
Curated OER
The Game of Chance
Third graders use manipulatives to determine the probability of outcomes. In this probability lesson, 3rd graders roll dice and use spinners to determine the probability of outcomes. They determine if games are fair/unfair based on their...
Curated OER
Another Dartboard
Fifth graders solve a word problem that involves predicting probabilities of an event and making deductions from probabilities. They discuss dice and coins and the probability of rolling each number or face of the coin, and in small...
Curated OER
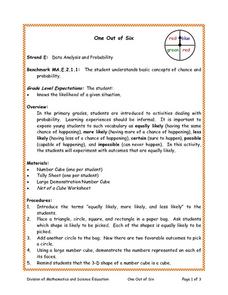
One Out of Six
Students investigate basic concepts of chance and probability. They make a number cube to predict which number might be rolled the most often out of 20 consecutive rolls and tally the results. Number cube template included.
Curated OER
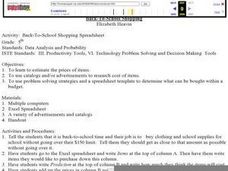
Back-To-School Shopping
Fifth graders estimate the prices of items to be bought for back to school. They use catalogs and/or advertisements to research the cost of each of the items. They use problem solving strategies and a spreadsheet template to determine...
Curated OER
ISTEP + Grade 6 Item Sampler
In this cross-curricular sampler of worksheets, students determine the meaning of specialized vocabulary and to understand the precise meaning of grade-level-appropriate words, describe and connect the essential ideas, arguments, and...
Curated OER
Mean, Median, Mode, etc.
Explore the concept of mean, median, and mode with pupils. They estimate the length of a string or the number of M&M's in a jar. Then find the mean, median, and mode of the class' estimates.
Pennsylvania Department of Education
What is the Chance?
Fourth and fifth graders make predictions using data. In this analyzing data lesson plan, pupils use experimental data, frequency tables, and line plots to look for patterns in the data in order to determine chance. You will need to make...
American Statistical Association
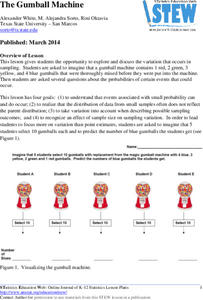
The Gumball Machine
Chew on an activity for probability. Given information on the number of gumballs in a gumball machine, scholars consider how likely it is to randomly draw a blue gumball and how many of each color they would draw in 10 trials if the...
Agriculture in the Classroom
Roll of the Genes
Animal reproduction in sheep and cattle is explored with the help of Punnet squares. Scholars employ tools using probability to conclude the color of wool a sheep's offspring will have. Acting as animal geneticists, pupils then take...
Curated OER
Data Analysis and Probability: Graphing Candy with Excel
Collect and graph data using Microsoft Excel with your math class. They will make predictions about the number of each colored candy in a bag of M&M's, then sort, classify, count, and record the actual data before using Excel to...
Curated OER
M&M Graphing
Youngsters sort M & M's by color. They graph the M&M's by color on a graph. This classic instructional activity is a wonderful way to introduce the concept and technique of graphing to young mathematicians. Pairs of kids can make...
Curated OER
Coal Supply and Demand
A hands-on simulation perfect for an economics lesson, young learners investigate the availability of different sources of natural energy (coal, natural gas, oil, solar, and nuclear) and how this availability affects their cost. Simulate...
Curated OER
Drive the Data Derby
Three days of race car design and driving through the classroom while guessing probability could be a third graders dream. Learn to record car speed, distances traveled, and statistics by using calculation ranges using the mean, median,...
Curated OER
Assessing and Investigating Population Data
Students examine population projections. In this population data lesson, students research and collect data on the population of the United States. They explore and conclude future population growth patterns. Students construct tables...
Curated OER
Genetics
Become familiar with the basic concepts of inheritance. Your junior high students work through mulitple examples of crosses and calculate probabilities of trait occurance. The explain the concept that each parent contributes one half of...
American Chemical Society
Defining Density
Three simple activities kick off a unit investigation of density. Your physical scientists make observations on the volume and mass of wood, water, and rocks, and make comparisons. Though this is written for grades three through eight,...
Curated OER
How To Measure Area
Geometers learn how to measure the area in square units. They use the floor in the classroom as a visual to measure a square foot area. They use classmates to fill the space and expand the measured area square foot by square foot until...
Curated OER
What Are The Odds?
Students read the book, Jim Ugly, and discuss whether the odds were in favor of or against the character Jake finding his dad. They demonstrate an experiment involving odds by keeping a tally of how many times a colored die is pulled out...
Curated OER
The Average Kid
Students determine the traits they have in common with other students in the class and create visual profiles of the "average" boy and the "average" girl.
Curated OER
Data Analysis, Probability, and Discrete Mathematics
Fourth graders analyze the data in a bar graph, pictograph, line graph, and a chart/table and draw conclusions based on the data. They discuss each type of graph, write questions for each graph, and analyze the data as a class.
Other popular searches
- Probablity and Dice
- Probablity Problems
- Experimental Probablity
- Statistics and Probablity
- Combinations Probablity
- Probablity Math Lessons
- Data Analysis and Probablity
- Probablity Lesson Plans
- Predictions and Probablity
- Equally Likely in Probablity
- Probablity Math


