Curated OER
"How Do You Measure Up?"
Fourth graders explore basic measurements by analyzing their own bodies. In this human anatomy lesson, 4th graders identify the units used to measure a human body such as centimeters, inches, ounces and pounds. Students complete a...
Curated OER
Environmental Graphing
Students experiment with graphing. In this graphing introduction lesson, students complete four activities: 1) a bar graph based on class birthdays 2) an estimation graph of the raisins in raisin bread 3) another estimation example with...
Curated OER
Clothing Choices
In this combinations worksheet, students circle the letter for the group that shows all the different combinations of 1 coat, 1 hat, and 1 scarf. They look at clip art pictures of 2 hats, 2 scarves, and 2 coats and decide which grouping...
Curated OER
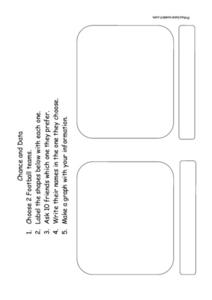
Chance and Data - Data Collection
In this data and probability worksheet, students choose two football teams and label the graphic organizer. They question 10 friends as to which team they prefer and write their names in the organizer. They make a graph that displays the...
Curated OER
BBC Bird Pictogram- Math Worksheet
In this British math worksheet, learners develop a pictogram based on the information that is given about what certain types of birds like to eat. They see pictures of the birds and their food preferences before completing the data in...
Curated OER
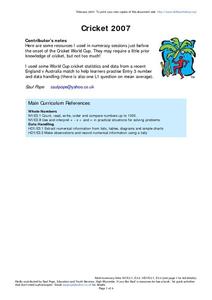
Cricket 2007
In this math and sports worksheet, learners read and review the statistics from the performance of teams in the Cricket World Cup. They identify which team played the most matches and who won the most. Students also compare the...
Curated OER
Blank Bar Graph- Intervals of 3
In this bar graph worksheet, students use the blank bar graph grid to display data. The interval is counting by 3. There are no problems given.
Curated OER
Pet Count Excel Graphing
Students used collected data to distinguish what pets they have or would like to have. They correlate findings with appropriate technology--Excel. At the end of the lesson they tabulate a bar chart and present their findings to the class.
Curated OER
Monitoring Math with a Statistical Spreadsheet
Students use a spreadsheet to compute landmark statistics of a math
quiz. This lesson can be ongoing throughout the school year and it integrates mathematics curriculum and technology in a simple format for student use.
Curated OER
Hermit Crab Races
Students predict the speeds of humans and hermit crabs and investigate their predictions using ratios and formulas. AppleWorks is used for this lesson, which includes a data worksheet.
Curated OER
M&M Statistics
Students determine the difference between guessing and making a prediction. They discuss what they could graph using a bag of M&M's. They take a Raw data sample and convert it into a sample. They graph the actual results and combine...
Curated OER
The Colored Cube Question
Fourth graders examine how to determine the probabilities or likelihood of outcomes. They complete trials to determine probability while using different manipulatives. They determine how games can be made fair or unfair in this unit of...
Curated OER
Grabbing CDs
Third graders determine the likelihood of an event. They randomly choose two CD's from a rack of eight. They determine all the combinations of CD's they can make and explain how they know when they have found all the combinations.
Curated OER
The Clumsy Tiler S
Fourth graders solve a series of parallel problems. They use statistics, geometrical, and numerical aspects to solve the problem. Students create a pattern that answers the problem.
Curated OER
Grade 3: Pretzel Probability
Third graders discuss prizes included in products to stimulate sales. They discuss a pretend pretzel company and it's sticker promotion. Students compute how many boxes of pretzels they will need to collect in order to be sure of having...
Curated OER
Exploring Probability
Fourth graders play a dice game as a group and record the number rolled. They report their findings and discuss terminology and ways of writing what the odds are of getting certain numbers.
Curated OER
Enhancing Writing Through Technology
Students participate in a class survey of their favorite activity to do in the snow and organize the results in a graph. They write a paragraph about the graph using language from a class-developed word web and include both an opening...
Curated OER
The Car Pool is Coming
Students evaluate the number of people who travel out of their town to work. They figure out what the percentage of each town's commuting workers is to the number who commute in the region. They plot the percentages on a pie chart.
Curated OER
How's the Weather
"How's the Weather?" is an exercise that combines science and math as learners graph the weather along the Iditarod Trail. They complete a double-line graph of the weather of a chosen checkpoint over the course of one week. Students...
Curated OER
Manatee Awareness Survey
Students examine the public's awareness of manatees by taking a survey. They display the results of the survey as a graph.
Curated OER
Growing Up With A Mission
Student measure heights and graph them using growth charts for which they find the mean, mode, and median of the data set. They graph points on a Cartesian coordinate system.
Curated OER
Time, Tide, and Quahogs
Students read tide tables for Waquoit Bay as the simulate determining the best time to go clam digging for a Wampanoag clambake. They graph the tide tables while realizing that the tides a Waquoit Bay are one hour later than those at...
Curated OER
Probability of a Boy
Students investigate the concept of even change by participating in a coin flip activity. They research using the Internet to investigate the chance of giving birth to a boy.
Curated OER
Watermelon Math
Students compute the mean and median of the number of seeds in a watermelon. They work in groups with a slice of water to complete and compare their calculations. They get a class average and mean.


