Curated OER
On the Surface
Students draw and label the 15 major rivers in Texas. They then draw and label another map with the major lakes and reservioirs of Texas. Students use the maps and locate and label the location of the following major Texas cities:...
Curated OER
America the Beautiful
Students listen to a read-aloud discussing the landmarks of the United States. In pairs, they use the internet to research a landmark of their choice. They create a visual aid to be given with a presentation sharing the information...
Curated OER
Getting Ready for Success
Third graders review the poem and activity from the previous session and then work in groups of four to tape skill strips in the appropriate category on a Venn Diagram. Next, a spokesperson from each group gives a report summarizing...
Curated OER
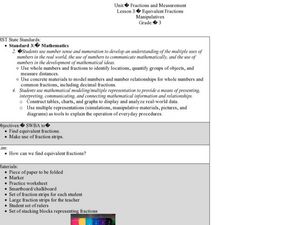
Equivalent Fractions Manipulatives
Students study fractions. For this equivalent fractions lesson, students utilize fraction strips to enhance their understanding of equivalent fractions. They watch a demonstration and then work independently with their own set of...
Curated OER
Living Things Depend upon Each Other
Students research animals. They identify the animals' struggle for survival, and internalize the importance of preserving an ecosystem with animal life.They collect information and write a report on their findings. Additional cross...
Curated OER
Arthropod Data Collection
Students describe the life cycle of various bugs as well as their predators and feeding habits. The class participates in a discussion of the various methods scientists use to gather data including research and experiment. After...
Curated OER
Animal Research Project
Third graders prepare an oral report using Appleworks to present information on their animal. They write a short narrative comparing and contrasting their animal to another students and, after watching other presentations, discuss what...
Curated OER
social studies: Life in Colonial America
Students explore the trials and tribulations early colonial life and note its successes. Through literature, Internet research, and interactive software, they engage in various activities to evaluate early social and cultural development.
Curated OER
Wolves
Learners utilize several different sources to research wolves, after completing the K-W-L process.
Curated OER
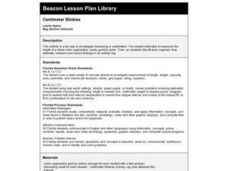
Centimeter Slinkies
Third graders estimate and measure the length of a whole color-segmented, candy gummy worm. Then, as students bite off each segment, they estimate, measure and record findings in an activity log.
Curated OER
Clouds
Third graders complete various activities about clouds. They create a cloud in a lab, write a cloud story, make a cloud model and complete a webquest.
Curated OER
Measuring to the Nearest Inch
Third graders use whole numbers and fractions to make connections between abstractions of the mathematical world and the real world. In this fractions and measurement lesson, 3rd graders identify, quantify groups , and measure distances....
Curated OER
A Bird's Eye View of our 50 States
Third graders focus on state birds as they learned absolute location (latitude/longitude) of each state, as well as their relative location (bordering states).
Curated OER
Science: Hurricanes As Heat Engines
Learners conduct Internet research to track the path of Hurricane Rita. They record the sea surface temperature of the Gulf of Mexico during and after the hurricane and draw conclusions about how hurricanes extract heat energy from the...
Curated OER
Surface Water Supplies And The Texas Settlements
Students engage in a lesson that is concerned with the allocation and finding of water resources. The location of different settlement areas is considered as one looks how the water is distributed. They map some of the early Spanish and...
Curated OER
Quarter Coin Cookies
Students study the historical figures and symbols of U.S.
patriotism depicted on the penny, nickel, dime, and quarter coins. They explore the processes involved in making coins, and how metals canchange in consistency from the...
The Franklin Institute
Frankin Institute Online: Group Graphing
This site from The Franklin Institute explores how to make a simple graph using a spreadsheet to portray survey data. It also gives a set of interesting sports-related web sites so that students can get statistical inforamtion.
PBS
Pbs Mathline Lesson Plan: Struts'n Stuff [Pdf]
Incorporating concepts in algebra, number sense, patterning, data collection, and geometry, this lesson engages students in various hands-on activities to explore the relationship between regular polygons and the number of diagonals...


