Hi, what do you want to do?
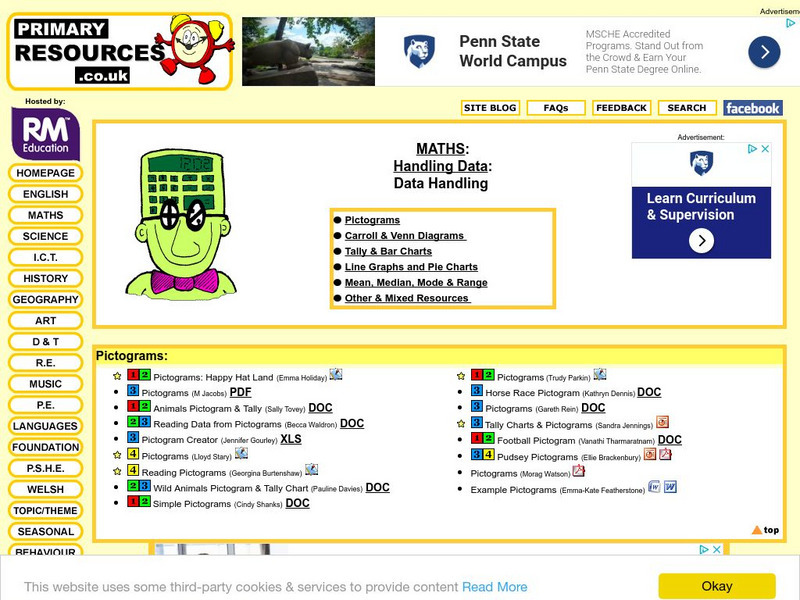
Primary Resources
Primary Resources: Tally and Bar Charts
Lots of good materials for teaching about tally marks and bar graphs.
PBS
Pbs Learning Media: Raising the Bar
Harry and Bianca's new boss at a concession stand uses bar graphs to keep records of their refreshment sales in this video from Cyberchase.
Khan Academy
Khan Academy: Make Bar Graphs 1
Practice creating bar graphs (bar charts) from data sets. Students receive immediate feedback and have the opportunity to try questions repeatedly, watch a video or receive hints.
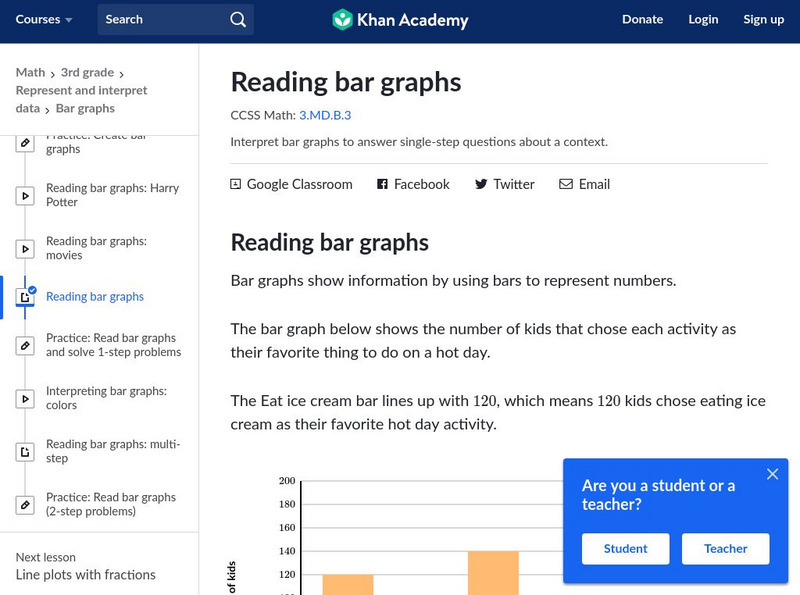
Khan Academy
Khan Academy: Reading Bar Graphs
Explains what bar graphs are, their uses, and presents practice problems for creating a bar graph and answering questions about them. Problems are accompanied by detailed solutions.
Khan Academy
Khan Academy: Make Bar Graphs 1
A practice quiz where students construct bar graphs using the given information. Includes hints.
SMART Technologies
Smart: Bar Graphs
This smart note book explains reading bar graphs, the parts of a bar graph, the steps to produce a bar graph and allows classes to input data a produce some bar graphs.
ABCya
Ab Cya: Fuzz Bugs Graphing
Students drag the fuzz bugs into the correct container to create a bar graph that is used to compare data.
US Department of Education
National Center for Education Statistics: Create a Graph Tutorial
This tutorial walks students through how to create different types of graphs using the Create a Graph tool available on the website. Covers bar graphs, line graphs, pie charts, area graphs, scatter plots, and dependent and independent...
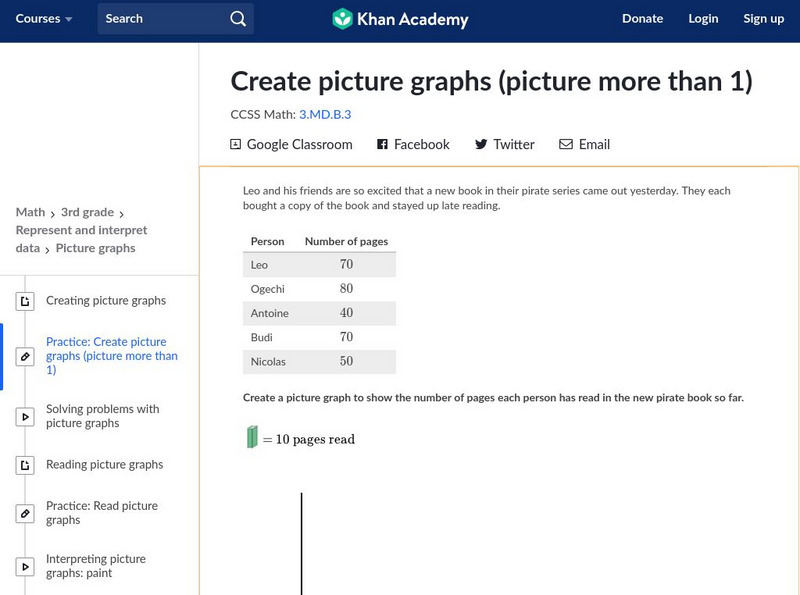
Khan Academy
Khan Academy: Create Picture Graphs (Picture More Than 1)
Create and interpret picture graphs. Students receive immediate feedback and have the opportunity to try questions repeatedly, watch a video tutorial, or receive hints about how to create picture graphs. CCSS.Math.Content.3.MD.B.3 Draw a...
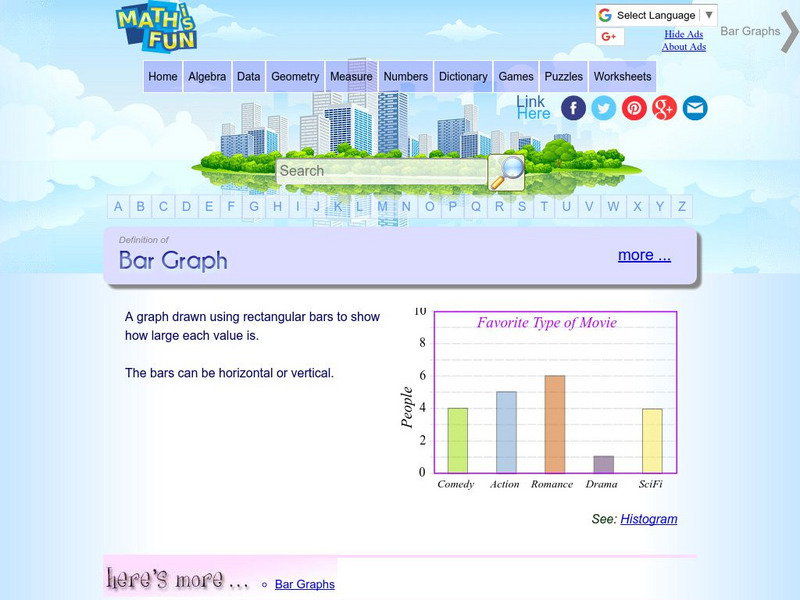
Math Is Fun
Math Is Fun: Definition of Bar Graph
Get the definition for a bar graph. Then, select the link "here's more" and use the interactive graph to display data as a bar graph, line graph or pie chart. The finished graph may be printed.
That Quiz
That Quiz: Practice Test: Graphs
This resource allows users to test their knowledge of graphs and graphing methods.
The Franklin Institute
Frankin Institute Online: Group Graphing
This site from The Franklin Institute explores how to make a simple graph using a spreadsheet to portray survey data. It also gives a set of interesting sports-related web sites so that students can get statistical inforamtion.
Rice University
Rice University: Cynthia Lanius: Let's Graph
An introduction to bar graphs, both vertical and horizontal in nature. The interactive aspect of this site allows students to change the values of the data - their favorite cafeteria foods - and then see how the graph is changed.
Khan Academy
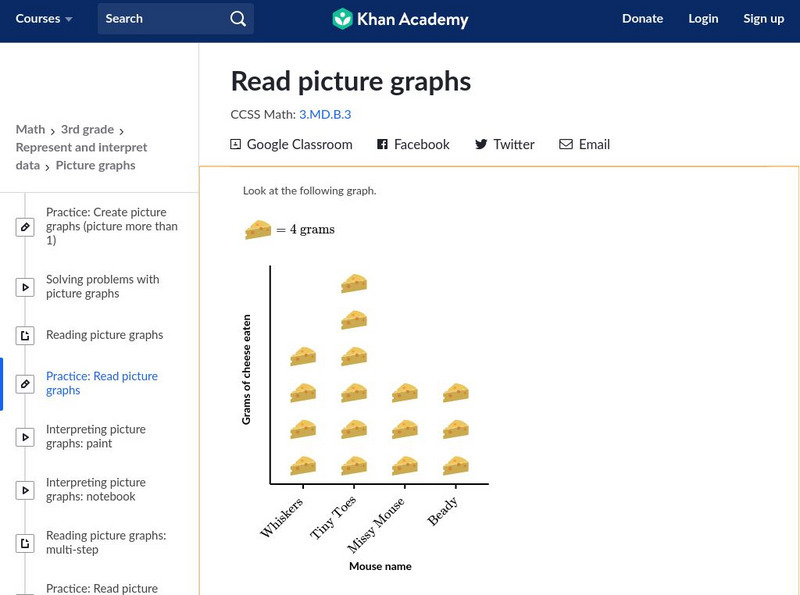
Khan Academy: Read Picture Graphs
Use picture graphs to solve word problems. Students receive immediate feedback and have the opportunity to try questions repeatedly, watch a video or receive hints. CCSS.Math.Content.3.MD.B.3 Draw a scaled picture graph and a scaled bar...
National Council of Teachers of Mathematics
Nctm: Illuminations: Bar Grapher
Graph data sets in bar graphs.
ArtsNow
Arts Now Learning: We Are Living Graphs and Data [Pdf]
In this lesson, 3rd graders use their own bodies to create bar graphs and do problems involving addition, subtraction, and more or less amounts. They then create their own graphs, incorporating the features of graphs that they have...
Math Is Fun
Math Is Fun: Data Graphs
Create and customize a bar graph, line graph, or pie chart based on a set of data and print it out.
Better Lesson
Better Lesson: Graphing Meaningful Data
Students use their timed test scores to create a bar graph that compares their progress in learning math facts.
Better Lesson
Better Lesson: Class Surveys and Graphs
Students love graphing data that they "own". In this plan, the class will select a type of graph and create it using a class survey frequency table. Included in this lesson are videos of the class engaged in the lesson and samples of...
ClassFlow
Class Flow: Data Analysis Using Graphing
[Free Registration/Login Required] This flipchart allows students to analyze data using appropriate graphs, including pictographs, histograms, bar graphs, line graphs, circle graphs, and line plots introduced earlier, and using...
US Department of Education
Nces: Create a Graph: Kids Zone
Make your own pie, bar, line, area or XY graph with this interactive tool. Look for examples of graphs already created from data collected by the National Center for Education Statistics. Complete with a graphing tutorial.
National Center for Ecological Analysis and Synthesis, University of California Santa Barbara
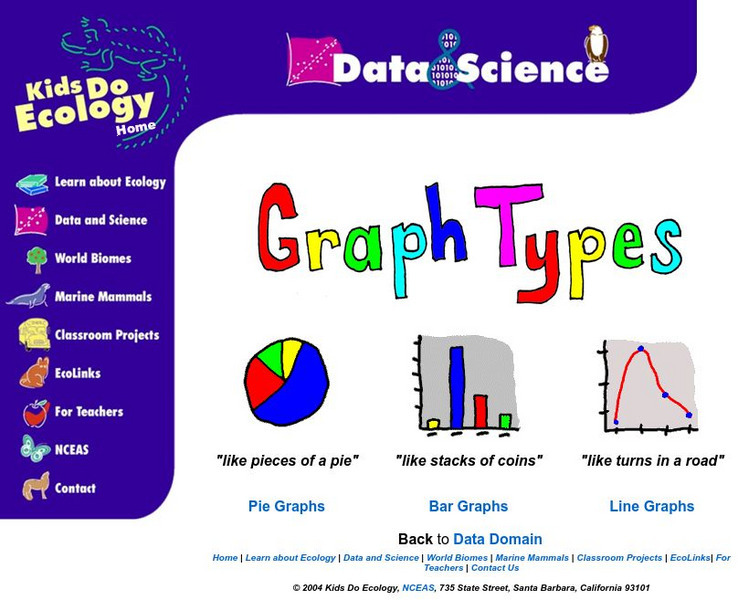
Nceas: Graph Types
At this site from NCEAS you can learn how to organize your data into pie graphs, bar graphs, and line graphs. Explanations and examples are given of each graph along with several questions that check comprehension.
E-learning for Kids
E Learning for Kids: Math: Russian Toy Store: Data and Graphs
Students will play a learning game to interpret data on graphs.
ClassFlow
Class Flow: Thanksgiving Graphing
[Free Registration/Login Required] Students will interpret data from a bar graph and a pictograph. They will then create one of each on the Activboard. This flipchart includes links to websites and an Activote quiz.
Other popular searches
- Skittles Bar Graph
- Double Bar Graphs
- Bar Graphs Pictographs
- Histogram and Bar Graph
- Bar Graphs and Histograms
- Bar Graph Problem Solving
- Favorite Food Bar Graph
- Bar Graphs Histograms
- Interpreting Bar Graphs
- Bar Graphs for Birthdays
- Bar Graph Worksheet
- Bar Graphs and Charts


