Curated OER
Leaping Lemurs! How far can you jump?
Students watch a segment of the PBS video which show the lemurs' ability to jump. In pairs, students collect measurement data involving each other's length of a standard step, a standing broad jump, and a long jump. They record their...
Curated OER
One Hundred Hungry Ants
Primaries read the book One Hundred Hungry Ants and solve word problems based on the book. In this word problems lesson plan, students will be able to find the factors of a number by organizing counters into equal rows.
Curated OER
We Are Family
Students explore art and stories that depict families in different cultures. They examine how family members help each other, create traditions, have fun and change or grow. They describe their own families and create a class family...
Curated OER
Go, Speed Reader, Go
Young scholars increase their reading fluency through the use of various strategies. After reviewing chunking, decoding, and rereading, students complete an initial read of a novel text. Working in small groups, they read complete a...
Curated OER
Around the World
Students explore ways people from around the world are like them. They discuss how geography affects the way people live and work and how culture affects a person's day to day life. Students give a presentation over a chosen country to...
Curated OER
Favorite Christmas Carols
Third graders take a survey of friends' and family members' favorite Christmas carols. They illustrate a favorite Christmas carol and have students try to guess the name of the carol based on the picture.
Curated OER
An Apple A Day
Students create a graph that showcases their pick for favorite kind of apple. Students are given samples of a variety of apples to determine their favorite in a taste test. They a create a tally chart of favorite kinds apples and use a...
Curated OER
Do You See What I See?
Students observe and describe different objects seen under a microscope and compare the individual perspectives of what was seen.
Curated OER
One Square Foot
Young scholars identify, describe, count, tally, and graph life found in one square foot of land.
Curated OER
Looking at Data
Third graders use two days to create, collect, display and analyze data. Classroom activities and practice build greater understanding to a variety of forms used to display data.
Curated OER
Mother May I?
Third graders measure distance using nonstandard units of measure. In this measurement activity, 3rd graders measure a given distance through the use of the game "Mother May I?" Student gather and compare data on how many "giant steps"...
Curated OER
Telling Time to 5 Minutes
Students take part in various activities ranging from creating a human clock, to small group problem solving to reinforce the concept of telling time accurately to five minutes on an analog clock.
Curated OER
Sky Watching
Learners trace how weather patterns generally move from west to east in the United States.
Curated OER
A Bird's Eye View of our 50 States
Third graders focus on state birds as they learned absolute location (latitude/longitude) of each state, as well as their relative location (bordering states).
Curated OER
Thank You... Thomas Edison!
Students investigate the life of Thomas Edison. They research how he made a difference. They understand that accurate data collection is important for math. They create a chart using spreadsheet data.
National Center for Ecological Analysis and Synthesis, University of California Santa Barbara
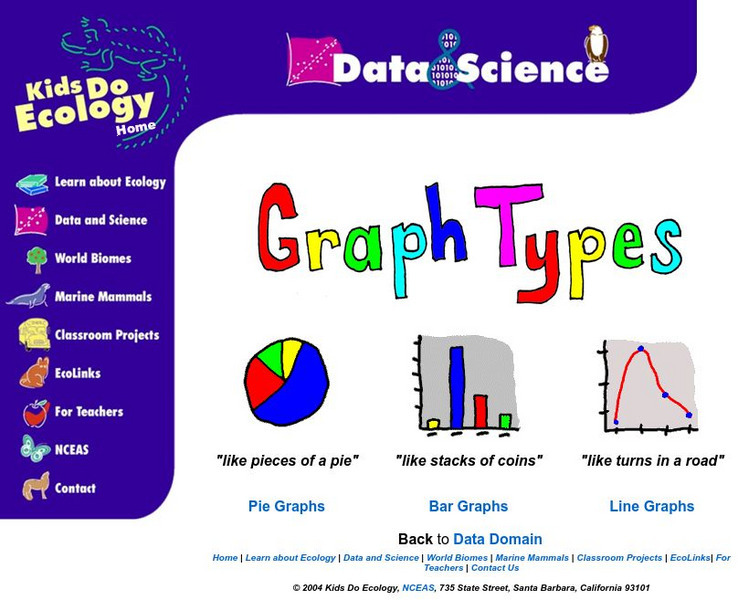
Nceas: Graph Types
At this site from NCEAS you can learn how to organize your data into pie graphs, bar graphs, and line graphs. Explanations and examples are given of each graph along with several questions that check comprehension.
US Department of Education
National Center for Education Statistics: Create a Graph Tutorial
This tutorial walks students through how to create different types of graphs using the Create a Graph tool available on the website. Covers bar graphs, line graphs, pie charts, area graphs, scatter plots, and dependent and independent...
Math Is Fun
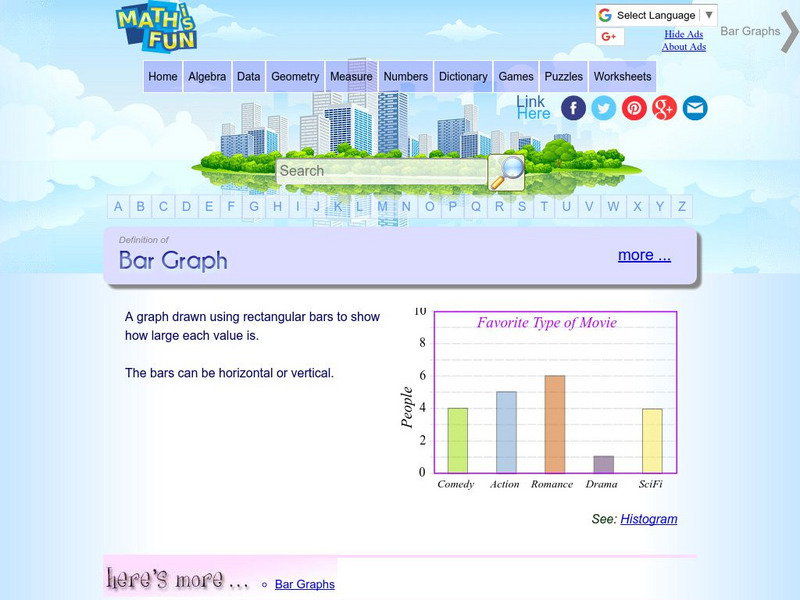
Math Is Fun: Definition of Bar Graph
Get the definition for a bar graph. Then, select the link "here's more" and use the interactive graph to display data as a bar graph, line graph or pie chart. The finished graph may be printed.
Math Is Fun
Math Is Fun: Data Graphs
Create and customize a bar graph, line graph, or pie chart based on a set of data and print it out.
University of Texas
Inside Mathematics: Parking Cars [Pdf]
This task challenges a student to use their understanding of scale to read and interpret data in a bar graph.
Education Development Center
Tune in to Learning: Reading Charts and Graphs
Practice graph reading skills with these exercises and companion tutorials.
The Math League
The Math League: Ratio and Proportion
This tutorial provides definitions and examples of ratios and proportions and features comparing ratios and converting rates.
Scholastic
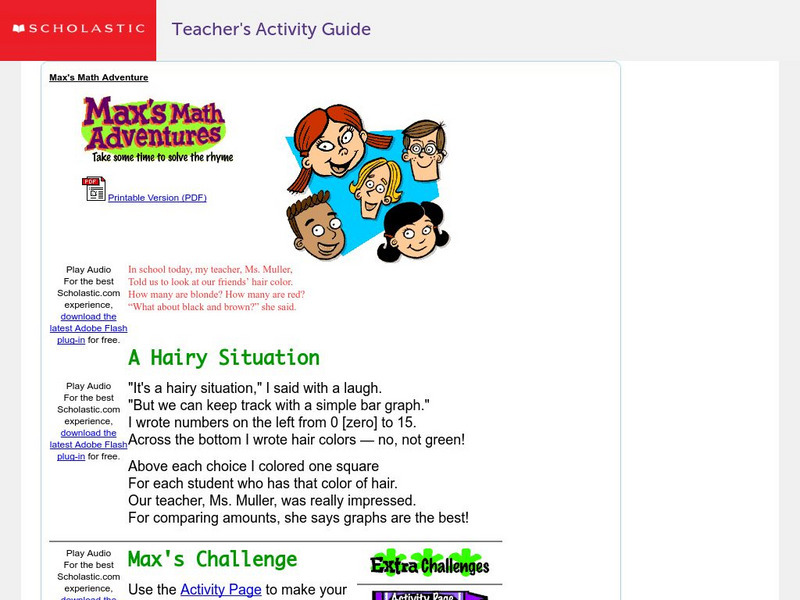
Scholastic: Max's Math Adventures: A Hairy Situation
Help Max make a bar graph to show the hair colors of his classmates. Teachers will appreciate the activities with bar graphs in the extra challenges. Use the teacher's guide to create a fun and engaging lesson.
The Math League
The Math League: Using Data and Statistics: Pie Charts
This introductory tutorial about statistical graphing with four examples of how pie charts (circle graphs) are constructed and read.


![Inside Mathematics: Parking Cars [Pdf] Lesson Plan Inside Mathematics: Parking Cars [Pdf] Lesson Plan](https://static.lp.lexp.cloud/images/attachment_defaults/resource/large/FPO-knovation.png)


