Hi, what do you want to do?
Curated OER
Building a Scale Model
Third graders create a model of the solar system. In this solar system lesson, 3rd graders create a scale model of the solar system. Working in pairs students solve mathematical problems to correctly measure the distance each planet is...
Curated OER
Lab Report Template
Students write a paragraph (complete sentences) which explains what they did in the lab.
Curated OER
Beat the Wheel
Learners recall basic multiplication facts by writing answers on a wheel form, competing against other teams to finish the wheels. They review multiplication facts on a Spinning Wheels Web Lesson.
Curated OER
The Dentist
Students read a short story about visiting a dentist. Then they use toothbrushes in order to demonstrate the correct way to brush teeth. Students use the internet to investigate how some foods are healthier for teeth than others. Then...
Curated OER
Cuisenaire Chefs
Students study the fractional values of Cuisenaire rods while working with favorite family recipes.
Curated OER
Wolves
Young scholars utilize several different sources to research wolves, after completing the K-W-L process.
Curated OER
Creating a Database: Africa, Technology, Social Studies
Young scholars use technology to create a database demonstrating their knowlede (in the case) of the African Continent. This project could be applied to almost any other concept studied.
Curated OER
A Thanksgiving Feast
Learners compare a Thanksgiving feast of today to the Thanksgiving feast of 1621. They analyze information to write a Rebus story about a Thanksgiving feast of today of the Thanksgiving feast of 1621. Pupils describe a typical...
Curated OER
Panther Scavenger Hunt
Students research a website to learn about the Florida panther. In this animal research lesson, students use the scavenger hunt directions to search a website about Florida panthers. Students also solve word puzzles within the activity.
Curated OER
Estimation With Percents
Students examine percents. In this percents activity, students will estimate percentages. Using advertisements from a newspaper, students problem solve to determine the final price of a sale item.
Curated OER
Sky Watching
Learners trace how weather patterns generally move from west to east in the United States.
Curated OER
Thank You... Thomas Edison!
Learners investigate the life of Thomas Edison. They research how he made a difference. They understand that accurate data collection is important for math. They create a chart using spreadsheet data.
Curated OER
Time Flies When Math Is Fun
Third graders pracdtice telling time with a demonstration clock.
Curated OER
Scavenger Hunt
Students search for items in various parts of the newspaper noting the different types of information it provides.
Quia
Quia: Reading Charts and Graphs Quiz
This 25-question quiz asks students to read various kinds of charts and graphs and to select the correct answers to the questions. Immediate feedback is provided after each question. Java is required.
Education Development Center
Tune in to Learning: Reading Charts and Graphs
Practice graph reading skills with these exercises and companion tutorials.
Read Works
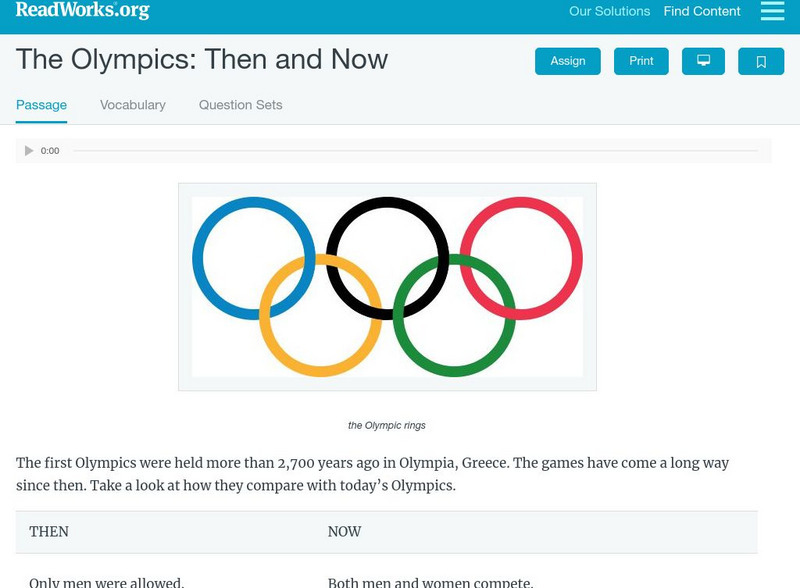
Read Works: The Olympics Then and Now
[Free Registration/Login Required] Students read two charts with information about the Olympics in ancient Greece and in modern times. A question sheet is available to help students build skills in comparing and contrasting.
US Department of Education
National Center for Education Statistics: Create a Graph Tutorial
This tutorial walks students through how to create different types of graphs using the Create a Graph tool available on the website. Covers bar graphs, line graphs, pie charts, area graphs, scatter plots, and dependent and independent...
National Center for Ecological Analysis and Synthesis, University of California Santa Barbara
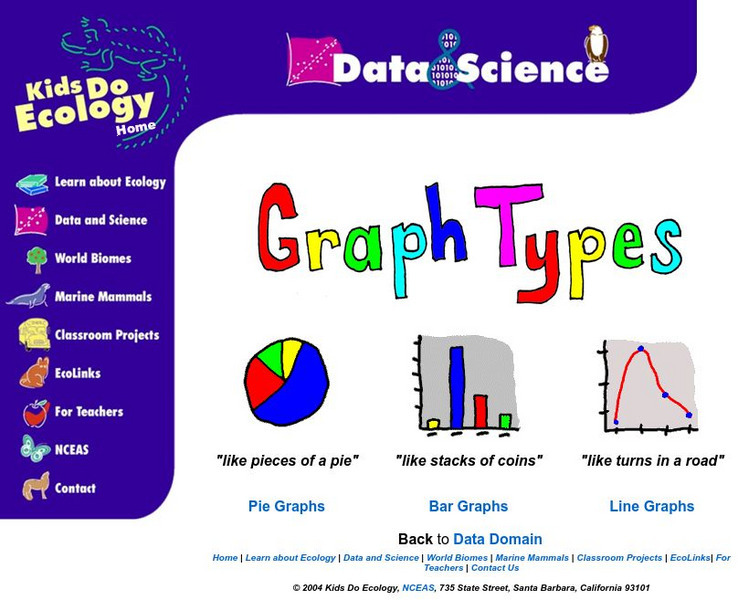
Nceas: Graph Types
At this site from NCEAS you can learn how to organize your data into pie graphs, bar graphs, and line graphs. Explanations and examples are given of each graph along with several questions that check comprehension.
The Math League
The Math League: Using Data and Statistics: Pie Charts
This introductory tutorial about statistical graphing with four examples of how pie charts (circle graphs) are constructed and read.
ClassFlow
Class Flow: Graphing Lists Tables
[Free Registration/Login Required] This lesson plan flipchart provides opportunities for interpreting information in simple tables and graphs.
Other
Kim's Korner: Graphic Organizers for Writing and Reading
What are graphic organizers for reading and writing? Use this site to learn more about these learning tools.
Primary Resources
Primary Resources: Line Graphs and Pie Charts
Here are a few resources to use with your students when teaching about line graphs or pie charts.
Math Is Fun
Math Is Fun: Data Graphs
Create and customize a bar graph, line graph, or pie chart based on a set of data and print it out.
Other popular searches
- Pie Charts and Graphs
- Reading Charts and Graphs
- Behavior Charts and Graphs
- Charts and Graphs Candy
- Interpret Charts and Graphs
- Charts and Graphs Christmas
- Charts and Graphs Math
- Analyzing Charts and Graphs
- Tables, Charts and Graphs
- Charts and Graphs Europe
- Using Charts and Graphs
- Bar Graphs and Charts


