Louisiana Department of Education
Louisiana Doe: Louisiana Believes: Eureka Math Parent Guide: Collecting and Displaying Data
A guide to support parents as they work with their students in collecting and displaying data.
Math Is Fun
Math Is Fun: Pictographs
Explains, with examples, what pictographs are and their limitations. Includes ideas for making a pictograph and a set of practice questions.
ClassFlow
Class Flow: Pictograph With Key Greater Than 1
[Free Registration/Login Required] This flipchart introduces reading a pictograph with a key greater than one, answering questions from data represented, find number of symbols to represent data by using a key, construct pictograph, and...
Illustrative Mathematics
Illustrative Mathematics: 3.oa, Md, Nbt Classroom Supplies
The purpose of this task is for students to solve problems involving the four operations and draw a scaled picture graph and a scaled bar graph to represent a data set with several categories. Aligns with 3.NBT.A.2;...
Khan Academy
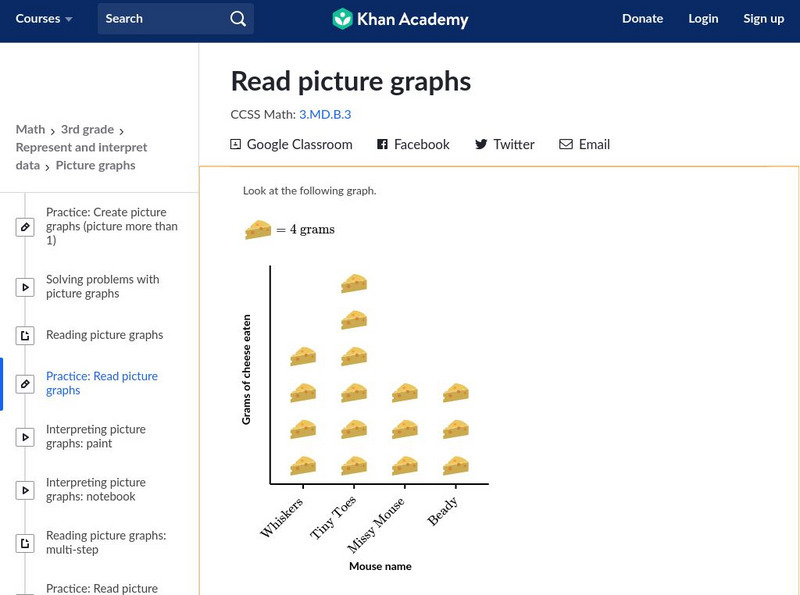
Khan Academy: Read Picture Graphs
Use picture graphs to solve word problems. Students receive immediate feedback and have the opportunity to try questions repeatedly, watch a video or receive hints. CCSS.Math.Content.3.MD.B.3 Draw a scaled picture graph and a scaled bar...
Khan Academy
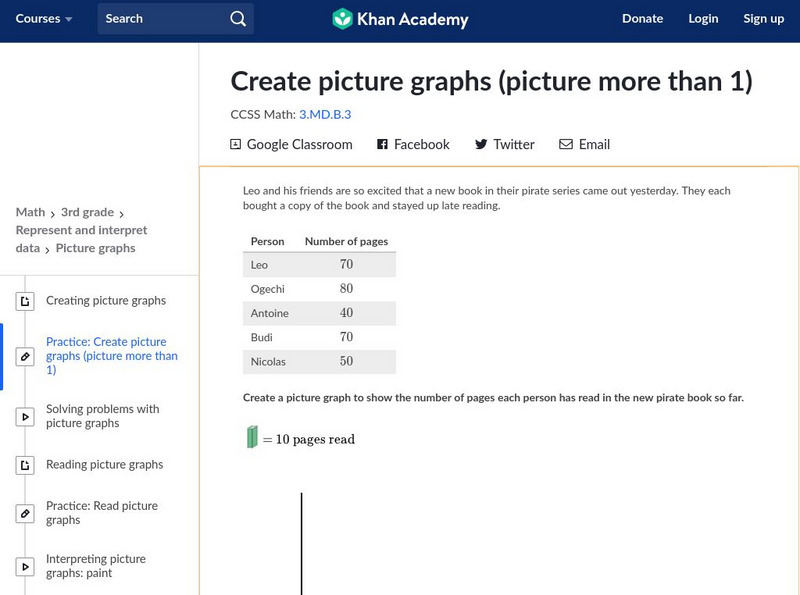
Khan Academy: Create Picture Graphs (Picture More Than 1)
Create and interpret picture graphs. Students receive immediate feedback and have the opportunity to try questions repeatedly, watch a video tutorial, or receive hints about how to create picture graphs. CCSS.Math.Content.3.MD.B.3 Draw a...
Khan Academy
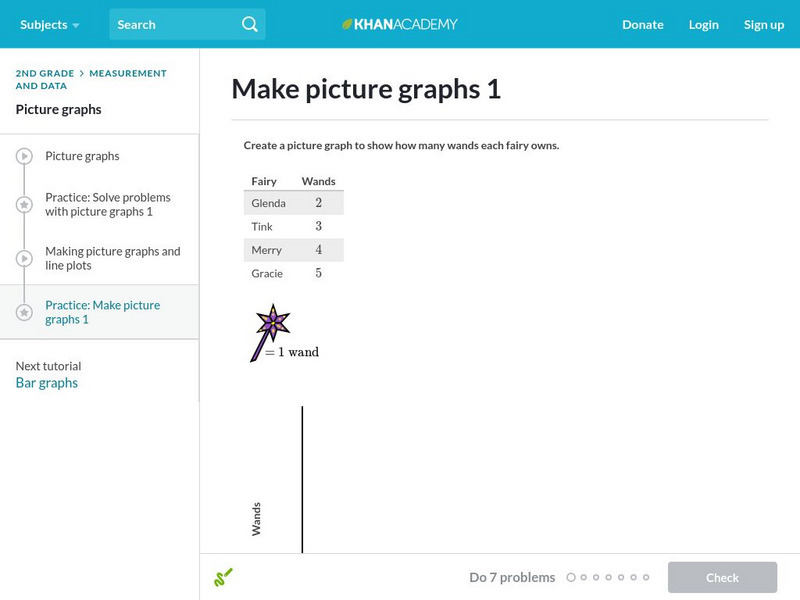
Khan Academy: Make Picture Graphs 1
Practice creating picture graphs (pictographs) from data sets. Students receive immediate feedback and have the opportunity to try questions repeatedly, watch a video or receive hints.
Khan Academy
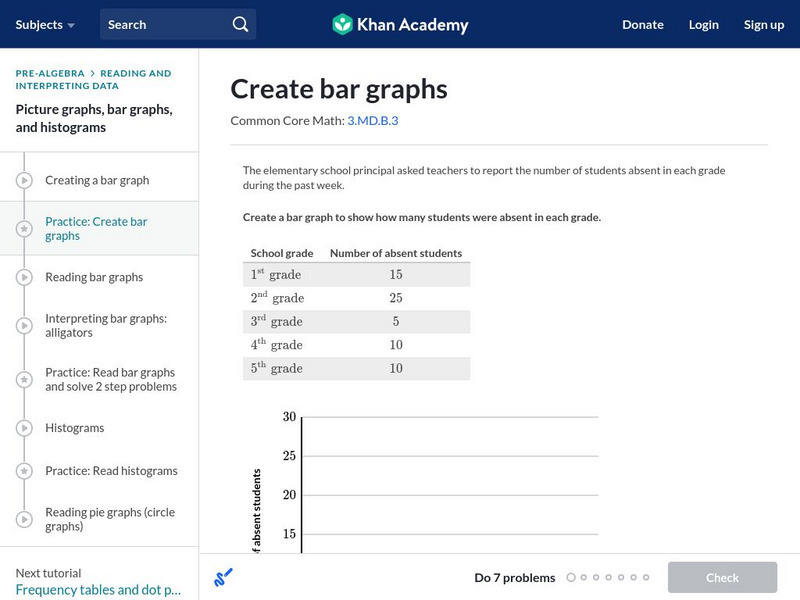
Khan Academy: Create Bar Graphs
Create a bar graph with the data given. Students receive immediate feedback and have the opportunity to try questions repeatedly, watch a video tutorial, or receive hints about creating bar graphs. CCSS.Math.Content.3.MD.B.3 Draw a...
Khan Academy
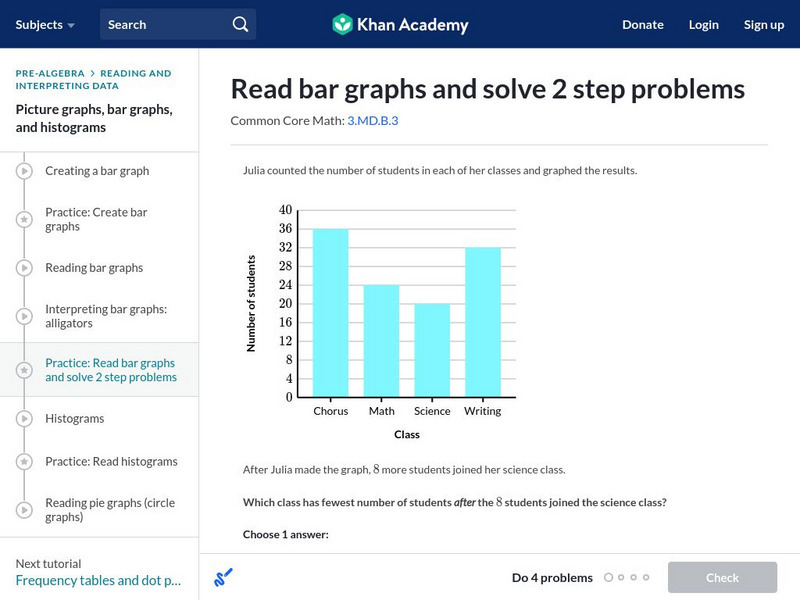
Khan Academy: Read Bar Graphs and Solve 2 Step Problems
Read and interpret a double bar graphs. Students receive immediate feedback and have the opportunity to try questions repeatedly, watch a video or receive hints. CCSS.Math.Content.3.MD.B.3 Draw a scaled picture graph and a scaled bar...
Better Lesson
Better Lesson: Graphing Our Favorite Ice Cream
Third graders can collect and represent data with a unique scale.
ClassFlow
Class Flow: Thanksgiving Graphing
[Free Registration/Login Required] Students will interpret data from a bar graph and a pictograph. They will then create one of each on the Activboard. This flipchart includes links to websites and an Activote quiz.
Better Lesson
Better Lesson: Class Surveys and Graphs
Students love graphing data that they "own". In this plan, the class will select a type of graph and create it using a class survey frequency table. Included in this lesson are videos of the class engaged in the lesson and samples of...
Other
Ohio Department of Education: Third Grade Achievement Test (Practice Test) [Pdf]
Half-length practice test for the third grade OAT (Ohio Achievement Test). The test includes 15 multiple-choice and 5 open-response question dealing with topics such as measurement (time, angles, ruler), data analysis (bar graphs,...


