Hi, what do you want to do?
Curated OER
Building Brilliant Bar Graphs
Everything you need for a mini-unit on bar graphs is included in this lesson plan! It outlines three lessons and includes worksheets. Learners taste pretzels, shoot baskets (switching off hands), and grab candy, graphing results...
World Wildlife Fund
Bar Charts & Pie Charts
Learn about life in the Arctic while practicing how to graph and interpret data with this interdisciplinary lesson. Starting with a whole group data-gathering exercise, students are then given a worksheet on which they analyze and create...
Curated OER
Usage and Interpretation of Graphs
Cooperative groups are formed for this graphing activity. Each group must construct a graph that represents how many eyelets (the holes for laces in shoes), are present in their group. A whole-class bar graph is eventually constructed...
US Department of Commerce
Changes in My State
So much can change in seven years. Young statisticians choose three types of businesses, such as toy stores and amusement parks, and use census data to determine how the number of those businesses in their state changed between 2010 to...
Curated OER
Favorite Candy Bar Graph
Learners decide on six different types of candy bars to include in a data collection activity. Working in small groups, they survey a target group in a set amount of time. They access a Internet based graphing tool to create a bar graph...
US Department of Commerce
Immigration Nation
People come and people go. Given tabular census data on the annual number of immigrants from four different regions of the world between 2000 and 2010, pupils create double bar graphs and line graphs from the data. They analyze their...
Curated OER
Usage and Interpretation of Graphs
Students explore graphing. In this graphing lesson, students predict how many shoe eyelets are present in the classroom. Students count eyelets and work in groups to organize and chart the data collected. Students put all the data...
Math Moves U
Collecting and Working with Data
Add to your collection of math resources with this extensive series of data analysis worksheets. Whether your teaching how to use frequency tables and tally charts to collect and organize data, or introducing young...
National Security Agency
Line Graphs: Gone Graphing
Practice graphing and interpreting data on line graphs with 36 pages of math activities. With rationale, worksheets, and assessment suggestions, the resource is a great addition to any graphing unit.
Curated OER
Pet Count Excel Graphing
Students used collected data to distinguish what pets they have or would like to have. They correlate findings with appropriate technology--Excel. At the end of the instructional activity they tabulate a bar chart and present their...
Curated OER
Usage and Interpretation of Graphs
Students review graphing and use processing skills to solve problems.
Curated OER
Predicting Temperature: An Internet/Excel Learning Experience
Third graders use the Internet (www.weather.com) to find the high temperature for our locale and the high temperature for another city around the world. They keep track of the temperature in these two locations for 10 days.
Curated OER
Plant a Seed of Kindness
Students perform acts of kindness. In this character lesson, students cut out seed shapes and write down their acts of kindness on them. Students place the seeds on a bulletin board where they "plant" them below the grass line.
Shodor Education Foundation
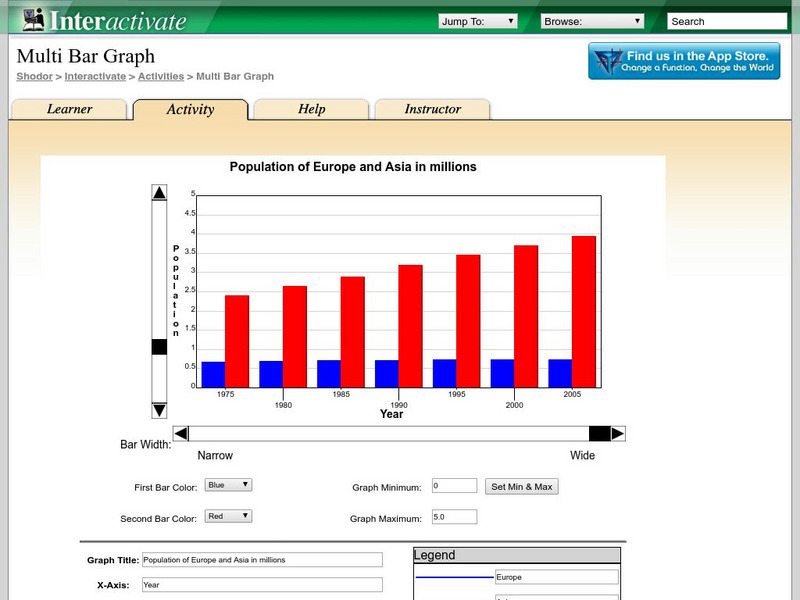
Shodor Interactivate: Multi Bar Graph
The interactive learning activity allows students to manipulate a double bar graph. Teacher resources are included.
ClassFlow
Class Flow: Graphs
[Free Registration/Login Required] This flipchart presents bar and double bar graphs, line and double line graphs, pictographs, histograms, and circle graphs with review activities and web links for practice.
University of Cambridge
University of Cambridge: Nrich: The Pet Graph
On this one-page website, sharpen your logic and graph reading skills by figuring out which pet goes with each bar on the graph. The solution is available to double check your own solution.
National Council of Teachers of Mathematics
Nctm: Figure This: Census
Try this real world challenge that focuses on data collection, data analysis, and problem solving with information from the U.S. Census Bureau. Discover how these skills are applied in real life situations in this one page activity from...


