Curated OER
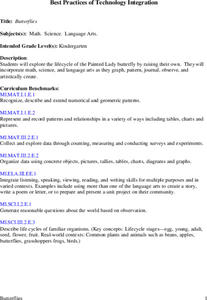
Butterflies
Students will explore the life cycle of the Painted Lady butterfly by raising their own. They will incorporate math, science, and language arts as they graph, pattern, journal, observe, and artistically create.
Curated OER
Using "Why Mosquitoes Buzz in People's Ears" to Teach Cause and Effect
Students discuss cause and effect relationships and the chain reaction involved before listening to the story "Why Mosquitoes Buzz in People's Ears". Students create flow charts to show the chain reactions of causes and effects in the...
Curated OER
Tally Time
Students create a tally chart. In this math and health activity, students discuss healthy foods and create a tally chart showing the number of students who like to eat healthy foods.
Curated OER
Awesome Animals
Students collect data from classmates about their favorite animal. They use the ClarisWorks graphing program to enter data, graph results, and interpret data.
Curated OER
Chart Trivia
Students practice addition and subtraction problems and answer questions using greater than and less than. They chart information to create a graph on the computer.
Curated OER
Bird Feeding and Migration Observation
Students research bird migration and build a bird house. In this bird lesson plan, students research the birds in their area and where they migrate to. They also build their own bird house and record data on what kinds of birds come to...
Curated OER
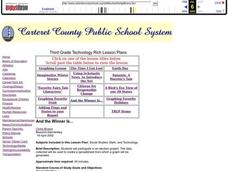
And the Winner Is...
Third graders participate in an election project. They collect data to create a spreadsheet from which a graph is generated.
Curated OER
One Square Foot
Students identify, describe, count, tally, and graph life found in one square foot of land.
Curated OER
Inventors Unit Survey
Students develop and conduct a survey for their inventors unit. They create a five question survey and tally the survey results, and create a graph using Microsoft Word and Graph Club 2.0.
Curated OER
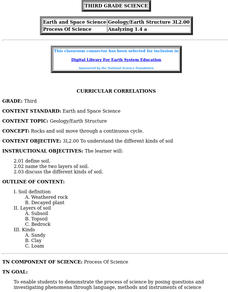
Curricular Correlations
An interesting lesson on different types of soils is here for you. In it, learners discuss what soil is, and consider three piles of soil - clay, sand, and loam. During the rest of the lesson, third graders discover all sorts of...
Curated OER
Use Google Maps to Teach Math
Capture the engagement of young mathematicians with this upper-elementary math lesson on measuring time and distance. Using Google Maps, students first measure and compare the distance and time it takes to travel between different...
Curated OER
Math! What's It All About?
Students explore what it means to solve problems and communicate in real life situations. They recognize math in a variety of real life materials. Also, they determine what procedures they use to solve a problem and what areas of math...
Curated OER
Population Pyramids
Students utilize population pyramids to answer questions, make comparisons, draw conclusions and support predictions about the populations of China, India and the Unites States. They arrange numbers and symbolic information from various...
Curated OER
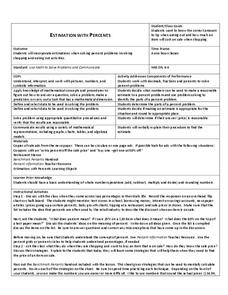
Estimation With Percents
Pupils examine percents. In this percents lesson, students will estimate percentages. Using advertisements from a newspaper, pupils problem solve to determine the final price of a sale item.
Curated OER
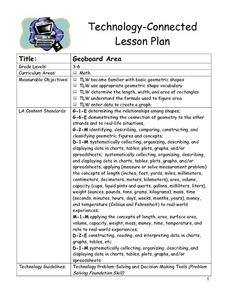
Geoboard Area
Young scholars explore the basic geometric shapes and geometric shape vocabulary through the use of geoboards and virtual geoboards. They create a variety of shapes with a partner, build ten different rectangles on their geoboards, and...
Curated OER
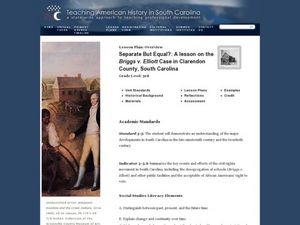
Separate But Equal? A Lesson on the Briggs v. Elliott Case in Claredon County, SC
Third graders discussschool integration. In this racial inequality lesson, 3rd graders read Remember: The Journey to School Integrationand discuss the school facilities and how people must have felt. Students watch a...
Curated OER
Traveling Southern Style: A Lesson on the Jim Crow Laws
Third graders create a poster of a travel route. In this discrimination lesson, 3rd graders read The Gold Cadillac and use it to discuss the problems African Americans faced while traveling south in the 1950's. Students compare three...
Curated OER
General Greene to General Marion: Your State is Invaded, Your All is at Stake
Third graders examine the contributions of Francis Marion and Nathaneal Greene. In this Revolutionary War lesson, 3rd graders use primary and secondary sources to research Marion and Greene and the accomplishments of their men during the...
Curated OER
My Family Tree
Students create a family tree. For this ancestry lesson, students research a country that one of their ancestors is from. Students interview a grandparent and map out a family tree.
Curated OER
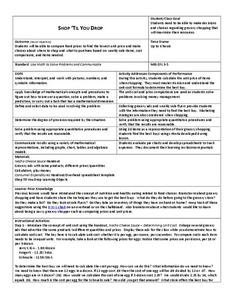
Shop 'Til You Drop
Students evaluate food prices. In this real world math lesson plan, students compare the cost of various grocery items to determine which is the best deal. They work in groups using grocery ads to decide how to get the most product for...
Laboratory for Atmospheric and Space Physics
Growing Up With A Mission
New Horizons began its journey to Pluto in 2006. Ten years later, it continues its mission. In that time, scholars have surely grown, but how much more will they grow by the time New Horizons reaches its destination? Find out with an...
Curated OER
On the Surface
Students draw and label the 15 major rivers in Texas. They then draw and label another map with the major lakes and reservioirs of Texas. Students use the maps and locate and label the location of the following major Texas cities:...
Curated OER
Closer To the Ground Lesson 2: Providing a Helping Hand
Learners examine how businesses and corporations contribute or sponsor activities for the common good. They read annual reports of major corporations to determine how they contribute to focused activities for the common good.
Curated OER
Drip, Drip, Drip
Students gather scientific data and be able to utilize the data to generalize results over a long period of time. They use the appropriate tools to measure quanities of liquids and analyze the data to determine the cost of a leaky faucet.
Other popular searches
- Tables, Charts and Graphs
- Tables Charts and Graphs
- Tables, Graphs, Charts
- Tables, Charts, Graphs
- Maps, Charts, Graphs, Tables
- Graphs Tables Charts
- Charts, Graphs and Tables
